Boosting future economic growth through diversification into more sophisticated industries: China, Viet Nam, Uganda, Indonesia and India leading the way
By: Timothy Cheston and Lorena Rivera León (World Intellectual Property Organization)
The journey towards economic development hinges upon the acquisition and utilization of productive knowledge, particularly in increasingly sophisticated – aka complex – industries and products. To chart a course toward robust economic growth, economies must effectively diversify into products that require rich and deep know-how which only a few other countries master, including innovation-intensive sectors such as information and communication technologies (ICTs), pharma, medical technologies, and different high-tech engineering products.
Embracing this premise, the Economic Complexity Index (ECI) of Harvard University, an indicator used in the Global Innovation Index (GII) 2023, evaluates economies’ competitive standing in terms of the advanced nature and diversification of their exports.
Based on this, Japan, Switzerland, Germany, the Republic of Korea, and Singapore top the rankings (see Figure 1). The Czech Republic, Austria, Sweden, Hungary and the UK (see Table 1) follow. The US ranks 12th.
Read the entire blog on Global Innovation Index Insights >>
Student Stories: Merging Data to Understand Emerging Global and Local Challenges

Rachel Chang is a second-year MPA/ID student at Harvard Kennedy School. She was accepted into the Growth Lab’s 2022 Fall and Winter RA Program where she helped construct visual stories that translate data and visualizations into timely insights for decision-makers.
Why did you apply for the Growth Lab RA position?
I applied to the Growth Lab RA position because I wanted to utilize the findings from the Atlas of Economic Complexity and Metroverse to create compelling data-driven visual stories. The Growth Lab RA position was a great way for me to contribute my product management experience, along with the analytical frameworks and economic rigor from the MPA/ID curriculum.
What did you work on?
I generated three distinct story concepts and eventually focused on Taiwan’s need for diversification beyond chips and semiconductors. This involved conducting outside research, using the Atlas of Economic Complexity and Metroverse, and working closely with the Growth Lab team.
In what ways were you challenged?
I was challenged because I wanted to connect country-level data from the Atlas and city-level data from the Metroverse to create a cohesive narrative for Taiwan. This was challenging because there wasn’t a clear connection between the data.
What was your most exciting/surprising experience?
The most exciting part was finding a way to bring the Atlas and Metroverse data together in a seamless manner. I was thrilled to see this piece come together using analytical economic methods and crafting a narrative.
What advice would you give future Growth Lab interns/RAs?
I would advise future Growth Lab RAs to supplement their RA-ship with courses, such as API313M: The Tools and Methods of Economic Complexity Analysis and DEV 309: Development Policy Strategy. The Op-Ed writing class at HKS was also especially helpful in providing best practices for writing compelling pieces (for those interested in writing short stories for the Growth Lab). The technicalities learned from these classes were directly relevant to my project analysis!
What’s next for you?
I’m further inspired to utilize data as a means to explore international economic growth opportunities and to bridge both the micro and macro aspects of economic advancement. I hope to continue working on these topics after graduating from the MPA/ID program.
Setting the Grounds to Measure Smallholder Farmers’ Complexity
By Laura Romero
The Growth Lab has estimated economic complexity, a measure of knowhow agglomeration, for several countries worldwide. However, measuring complexity in the agricultural sector poses a significant challenge. What is more, measuring it for smallholder farmers around the world is even more complex. Through our work, we have laid the groundwork for future measures of complexity for this population.
I joined the Growth Lab Agriculture Initiative last October, aware of how challenging it would be to answer this question. We started with the basics: Who are the small farmers? If you ask someone in India and someone in Albania, I assure you that the answers will diverge. In fact, the literature recognizes that smallholder farmers are a heterogeneous group (Ethical Trading Initiative, 2005; FAO, 2012). Some of the variables in which they differ include the following:

Typically, smallholder farmers produce relatively modest volumes of goods on small plots of land. They are generally less well-resourced, vulnerable in supply chains, and have limited access to markets and services. The most common criteria used to define smallholder farmers globally is land size, with a consensus that they work on land plots smaller than 2 hectares (Committee on World Food Security, 2016; FAO, 2012).
With this in mind, we explored worldwide data on these population. The most comprehensive datasets are published on the FAOSTAT statistics website, which contains information for over 145 countries. Relevant databases include Structural Data From Agricultural Census and Production Crops and Livestock Products (FAO, n.d.). By calculating comparative advantage indicators to get information on the productive capabilities, we determined that some countries have comparatively more smallholder farmers than others. These countries include Guatemala, Albania, Lebanon, Jordan, Egypt, Namibia, and India, among others.
Furthermore, using a programming function, we were able to determine the revealed comparative advantage (RCA) by crop and country for three time periods: 1990, 2000, and 2010. We also estimated which crops were the top five produced by each country and analyze whether these had comparative advantages with respect to the region.
Since worldwide information about country and hectares harvested for each crop is not available by land size, the next step was to compare the top five most produced crops by country and its RCAs with national information. For a subset of six countries, we analyzed which crops were most commonly harvested by smallholder farmers, using Agricultural Censuses of National Surveys. The countries are Guatemala, Colombia, Albania, Ethiopia, Namibia, and South Africa.
Guatemala and Albania stand out as countries with relatively more smallholder farmers’ land with respect to their respective regions, as well as to the set of developing countries in the world. In the case of Guatemala, coffee, sugar crops and maize are three out of the five most produced to display a comparative advantage with respect to Latin America. According to the country’s national survey, coffee and maize are among the most harvested crops by smallholder farmers (Instituto Nacional de Estadistica [INE], 2013). In the case of Albania, there are comparative advantages for cereals, pulses, and wheat, all produced by smallholder farmers (Institute of Statistics [INSTAT], 1998).
Colombia also has relatively more smallholder farmers’ lands compared to the other countries in the continent. Coffee, fruit, and rice are some of the most harvested crops in the country, with comparative advantages over other crops. From these, coffee, banana, and plantain are the most frequently harvested crops by small farmers (Departamento Administrativo Nacional de Estadistica [DANE], 2014).
Top 5 crops produced by country: Share and RCA – 2000

In Africa, Ethiopia and Namibia are highlighted as countries that have relatively more smallholder farmers’ land concerning their respective regions, as well as the set of developing countries in the world. In Ethiopia, cereal crops and wheat are two of the most produced to show a comparative advantage. According to the country’s Agricultural Census, cereals like teff, sorghum, barley, and wheat are among the most harvested crops by smallholder farmers (Central Statistical Agency [CSA], 2012). In the case of Namibia, there are comparative advantages for edible roots, cereals, and specifically millet. Indeed, millet is one of the most commonly harvested crops by smallholder farmers, along with sorghum (Ministry of Agriculture, Water and Rural Development [MAWRD], 1995).
Finally, South Africa stands out from other African and developing countries due to its relative lack of smallholder farmers’ lands. The countries’ top five harvested crops have a comparative advantage compared to the region. There are sunflower seeds, wheat, sugar cane, cereals, and maize. From these, smallholder farmers produce maize and sugar cane (Statistics South Africa, 1997).
Top 5 crops produced by country: Share and RCA – 2000
There have already been initiatives aimed at prioritizing specific products for smallholder farmers to integrate into local and global markets. One example is Japan’s One Village, One Product program, which was developed in 1979 to increase the value of locally produced goods and boost household and national income. The program targeted farmer groups and cooperatives, with one village sometimes prioritized. This public policy has been replicated in several countries (FAO, 2013).
More recently, the FAO launched the One Country Priority Product (OCOP) initiative to promote special agricultural products with unique qualities and characteristics. This project places smallholders and family farming at the center of interventions to improve access to stable markets and serve as a key entry point for achieving their defined priorities (FAO, 2022). Numerous countries have already defined which products to prioritize, taking comparative advantages into consideration. From the countries we analyzed, Guatemala prioritized coffee and Ethiopia prioritized teff.
Overall, we have laid the groundwork for future measures of complexity for smallholder farmers around the world. We have developed a methodology that uses comparative advantages to identify existing capabilities in different economies. We identified who the smallholder farmers are, where their lands are predominantly located, which crops are most harvested, and whether they display comparative advantages. Additionally, we have presented some initiatives that propose the prioritization of certain products to integrate smallholder farmers into local and global markets. Mapping the existing capabilities of different types of farmers and crops that diverge in productivity is a crucial first step in discussing economic complexity in smallholder farmers.
References
Central Statistical Agency. (2012). Statistical report on the 2010-2011 agricultural sample survey. Volume I: Statistical report on crops (private peasant holdings). Addis Ababa, Ethiopia. Retrieved from https://catalog.ihsn.org/catalog/1389/related-materials
Committee on World Food Security. (2016). Connecting smallholders to markets. Food and Agriculture Organization of the United Nations. Retrieved from https://www.fao.org/3/bq853e/bq853e.pdf
Departamento Administrativo Nacional de Estadística. (2014). Censo Nacional Agropecuario 2014: Resultados nacionales. Retrieved from https://www.dane.gov.co/files/images/foros/foro-de-entrega-de-resultados-y-cierre-3-censo-nacional-agropecuario/CNATomo2-Resultados.pdf
Ethical Trading Initiative. (2005). Recommendations for Working with Smallholders. Retrieved from https://www.ethicaltrade.org/sites/default/files/shared_resources/eti_smallholder_guidelines_english.pdf
FAO. (2012). Coping with the food and agriculture challenge: smallholders’ agenda. Retrieved from https://www.fao.org/fileadmin/templates/nr/sustainability_pathways/docs/Coping_with_food_and_agriculture_challenge__Smallholder_s_agenda_Final.pdf
FAO. (2013). Global application of the One Village One Product Movement concept: Lessons from the experiences of the Japan International Cooperation Agency. Rome, Italy: FAO. Retrieved from http://www.fao.org/3/a-i3251e.pdf
FAO. (2022). The Global Action on Green Development of Special Agricultural Products: One Country One Priority Product Action Plan 2021-2025. Retrieved from http://www.fao.org/3/cb5506en/cb5506en.pdf
FAO. (n.d.). FAOSTAT. Retrieved March 23, 2023, from https://www.fao.org/faostat/en/#data
Institute of Statistics. (1998). Albania – Agricultural Census 1998 – Main Results. Retrieved from https://www.fao.org/fileadmin/templates/ess/documents/world_census_of_agriculture/main_results_by_country/albania_2000.pdf
Instituto Nacional de Estadística. (2013). Guatemala – Encuesta Nacional Agropecuaria 2013. https://www.ine.gob.gt/encuesta-nacional-agropecuaria/
Ministry of Agriculture, Water and Rural Development. (1995). Namibia Agricultural Census 1995 – Main Results. Retrieved from https://www.fao.org/publications/card/es/c/8dc4e39c-6b78-4ddf-889c-180389c24900/
Statistics South Africa. (1997). South Africa Rural Survey 1997. Retrieved from https://microdata.worldbank.org/index.php/catalog/1602
Student Stories: Collecting Evidence to Help Smallholder Farmers Around the World

Laura Romero is a first-year MPA/ID student at Harvard Kennedy School. She was accepted into the Growth Lab’s 2022 Fall RA Program and contributed to our Initiative on Agriculture where the work included developing a framework to determine products that are suitable for smallholder farming agriculture and its integration into markets.
Why did you apply?
I applied to the Growth Lab RA program because I wanted to enrich my experience as an HKS student with some research experience. I wanted to apply some of the concepts and skills that I am learning outside of the classroom.
What did you work on?
I worked on the Initiative on Agriculture: Smallholder Complexity & Putting Collective Land to Work, where my main goal was to contribute to answering the question of how to measure complexity for smallholder farmers around the world. My work included literature review, data analytics, programming, and developing a general framework to identify existing capabilities in different economies using comparative advantages.
In what ways were you challenged?
It was challenging to think about smallholder farmers as one population target, as they are heterogeneous in different regions of the world. Moreover, it was an arduous task to gather information from different sources, including agricultural national censuses and surveys, and putting all the evidence together to tell a story. On a personal level, this project was my first exposure to research at Harvard, while being a graduate student. It was challenging to manage both roles at the same time.
What was your most exciting/surprising experience?
My most exciting experience was learning about agriculture databases in FAOSTAT and getting to code functions that last over time. Applying my previous knowledge of agriculture in Colombia to this project was also thrilling, as well as being able to get a better understanding of the issues affecting smallholder farmers around the world.
What advice would you give future Growth Lab interns/RAs?
First, dare to apply! Once you are in, try to learn everything you can, you are encouraged to ask questions and be curious. Compliment all the theory you learn in class with hands on research or experience in real world problems.
What’s next for you?
I still have to complete my second year in the MPA/ID program. This summer I will keep working in research, as I will be doing an internship in Innovations for Poverty Action based in Mexico City. This RA role further fueled my interest in agriculture and food security, and I hope to continue working on these topics after graduating the MPA/ID program.
‘Aha’ moments: On the ground in Kazakhstan with the private sector
Kazakhstan is one of the least densely populated countries in the world. It has an area roughly equal to that of all of Western Europe and a population of 19 million – around that of the Netherlands. Kazakhstan became Independent in 1991 after the fall of the Soviet Union and shortly thereafter experienced an oil boom. The global commodity super-cycle ended in 2014, and oil prices fell. Kazakhstan’s unique socioeconomic history and its vulnerability to commodity price shocks have led to three interrelated development challenges. The country’s large size and low population density mean it is a remote place, and economic innovation and productivity growth are impeded by the difficulty in agglomerating people in major urban centers. The dominance of oil in its export basket puts Kazakhstan at risk of the consequences of Dutch disease and resource-dependent growth. Finally, its history as a former Soviet-state leaves Kazakhstan with domestic macroeconomic imbalances and a loss of productive capacities as a result of the centrally planned economy of the Soviet Union.
Kazakhstan was able to achieve an impressive growth episode between 2000-2020, more than doubling its GDP per capita. This strong growth witnessed in the early and mid-2000s was fueled by the country’s hydrocarbon resources, structural reforms, and high Foreign Direct Investments (FDI). However, the fall in oil prices starting in 2014, the lack of economic diversification into non-oil tradables despite ample policy support, and recent geopolitical challenges have put the sustainability of growth in jeopardy.
The Growth Lab is currently engaged with the Government of Kazakhstan to help decision-makers promote sustained long-term growth and inform investment policy design. The research collaboration involves analyzing the country’s productive structure, identifying binding constraints to growth, and providing support for policy formulation and implementation with the aim of initiating sustainable and inclusive growth.
My internship with the Growth lab coincided with analyses that aimed to link growth diagnostics with policy recommendations. My internship, therefore, had three objectives. First, to dig deeper into some of the puzzles identified in constraints analysis. One of these puzzles I focused on was stagnant corporate growth despite generous policy support. The second objective was to formulate policy recommendations to ease the binding constraints identified in the areas of macroeconomics and finance. The third objective was to discuss the team’s diagnostics findings and policy recommendations with stakeholders on the ground in Kazakhstan.
My first few weeks of the internship were based at the Harvard Kennedy School, where I worked on assessing whether access to finance was a constraint to investments and growth in Kazakhstan. Kazakhstan has a stable deposit-to-GDP ratio but a declining private-credit-to-GDP ratio. Recognizing the role of access to finance in investment promotion, the government has implemented several credit initiatives to boost corporate credit, including subsidized lending, credit guarantees, and direct lending. However, corporate credit growth remained dampened despite policy support (Figure 1).
Figure 1.

In its diagnostic framework, the Growth Lab assesses whether access to finance is an obstacle to growth for many reasons. Constrained access to finance can reduce the potential for innovation by forcing companies to forgo investment opportunities and affecting companies’ survival and growth by contributing to working capital constraints. It might also reflect perceptions about the appropriability of returns on innovation and investment. Low corporate credit growth can be a result of supply constraints, demand constraints, or a mix of both. Supply constraints can result from a high price of credit, tight lending conditions, or poor intermediation that fails to allocate available capital to the most promising investment. On the other hand, demand-side constraints can be attributable to most of the branches in the Growth Lab diagnostic tree, including low social return on investments, low skills, and an unfair competition landscape. Thus, my analysis focused on assessing whether there are obstacles to access to finance and whether these obstacles result from supply-side constraints.
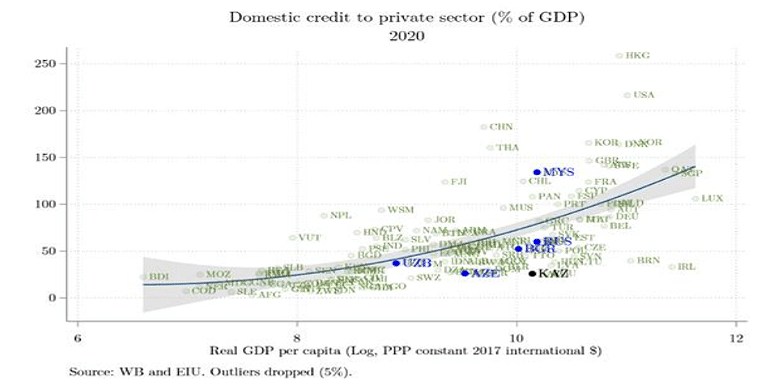
The analysis I did while in Cambridge enabled me to understand aggregate trends about credit growth in Kazakhstan and the aggregate scope and size of credit support policies. We learned that Kazakhstan’s private-credit-to GDP is well below the expected levels in its income group (Figure 2). We also found that while interest rates are slightly above average for its income group, collateral requirements are well above the average for Kazakhstan’s income group. This analysis helped us map potential constraints that affect almost all borrowers in Kazakhstan. We were also able to map these constraints to the available credit support policies to triangulate that while high interest rates were targeted with subsidized lending, high collateral constraints represented a blind spot in current support policies.
Figure 2.
I then began to analyze the size of the different credit support measures and found that most of the support goes into interest rate subsidies, which aims to decrease the cost of lending for firms. However, support aimed at mitigating the high collateral requirement was limited in comparison.
Building upon the framework taught to us in the MPA/ID program at HKS, the Growth Lab’s “holy trinity” for sound policy design relies on policies that are technically correct, administratively feasible, and politically supportable. It made technical sense to consider a policy shift from interest rate subsidies to credit guarantees, based on the signals we observed of high collateral requirements. However, we then tested the administrative feasibility of our policy proposal. To assess the administrative feasibility for expanding support to mitigate the collateral requirement constraint, I estimated the fiscal cost of interest rate subsidies and credit guarantees, assuming different scenarios for credit growth.
I then traveled to Nur-Sultan, Kazakhstan’s capital, where I stayed and worked for a month to test our findings and policy ideas with businesses in different sectors. My trip to Kazakhstan gave me many “Aha” moments as it provided me with hands-on conceptualizations of the importance of many of the concepts we covered during my first year in the MPA/ID. Professor Dani Rodrik’s class taught us, among many things, the importance of establishing channels of communication with the private sector that are governed by an institutional framework to keep the private sector at arm’s length. We discussed how this institutional framework should aim to keep the private sector close enough to provide feedback on implementation and insights on constraints, but also far enough to avoid risks of corruption and favoring certain businesses over others.
The opportunity to discuss issues such as low corporate credit growth and less-than-optimal investments with businesses on the ground provided me with insights on bottlenecks in the implementation of credit support policies and exporters’ support policies that I otherwise would have missed if I solely relied on quantitative analysis. Another “Aha” moment was seeing first-hand the heterogeneity of constraints and bottlenecks faced by businesses depending on their sector, size, level of innovation, and age. This heterogeneously is easy to miss when relying purely on quantitative desk research.
While I was aware of the unique insights I obtained during my time in Astana, I was also aware of the potential selection bias because I met with a small sample size of firms. I also knew that they might be telling me one thing but acting out other behaviors in reality. These were risks I knew going into the interviews, but nevertheless, the experience helped me reflect on common criticism towards the international development field due to the limited face time development practitioners have with local stakeholders and their limited and distant understanding of the context. We often tend to overlook that, in the absence of direct and frequent communication channels, even local bureaucrats and government officials have limited face time with businesses and beneficiaries of their policies. With low data availability in many developing countries, qualitative data from interactions with policy beneficiaries is even more crucial for policy design and implementation.
As I start my second year of the MPA/ID and prepare to rejoin the policymaking field after graduation, the lessons learned during my Growth Lab internship on the role of comparative statistics in diagnostics, diagnostic methodology of identifying constraints, and role of qualitative data in policy design and assessment are an essential addition to my Kennedy school experience.
Reflections on Decarbonization: Wyoming vs. Japan
This summer, as a Growth Lab intern, I conducted research on decarbonization in the United States. To gain a better understanding of this topic, I worked with an economist at the Center for Business and Economic Analysis (CBEA) at the University of Wyoming in Laramie. CBEA’s primary task is to work with other departments and state agencies to conduct economic assessments of industrial projects in Wyoming. Most recently, the University of Wyoming received funding from the U.S. Department of Energy for research focused on the use of coal to produce carbon ore, rare earth, and critical minerals1, and CBEA is studying this and other ‘technologies’ potential impacts on local industry. The University of Wyoming, as the ‘state’s only four-year university, provides critical research on economic and energy issues in Wyoming. Through my internship, I was able to deepen my understanding of Wyoming and U.S. energy policy.
The stay in Laramie was a fresh and valuable experience for me. What was particularly impressive to me was the strong attachment of the Wyomingites to nature. Here, nature means both natural resources and the landscape. In town, you can hear the sound of long freight trains carrying coal and other materials passing by regularly, reminding us that this is a resource-producing state. Also, just outside the city, great plains and mountains spread out, and people can easily enjoy hiking and fishing. In addition, every July, the city hosts a large rodeo festival, which is one of the liveliest events of the year. The locals living in this environment have a very strong sense of pride in nature, and it is completely different from that of Boston.
The global trend toward decarbonization, which has accelerated in recent years, may force a change in this identity. However, it is clear that overly simple strategies, such as replacing the shrinking coal industry with an increasing renewable energy, do not fully capture the complexities of economic geography and public opinion in Wyoming. According to a survey conducted by the University of Wyoming2, a high percentage of Wyomingites do not have strong resistance to new technologies such as small nuclear and renewable energy, but they do believe that they can be compatible with the old resource economy, including coal. Given that ‘residents’ views are reflected in policy through elections, local public opinion is as important a factor as economic rationality. This firsthand sense of local realities is what was meaningful I gained during my stay in Wyoming.
 The CBEA at the University of Wyoming conducts economic and business analytics. It also collaborates with other departments, such as the School of Energy Resources. |
 Adjacent to the downtown area, a freight railroad that carries coal and other materials runs day and night. |
 Wyoming’s beautiful nature. For many locals, the outdoors is a part of their everyday life. |
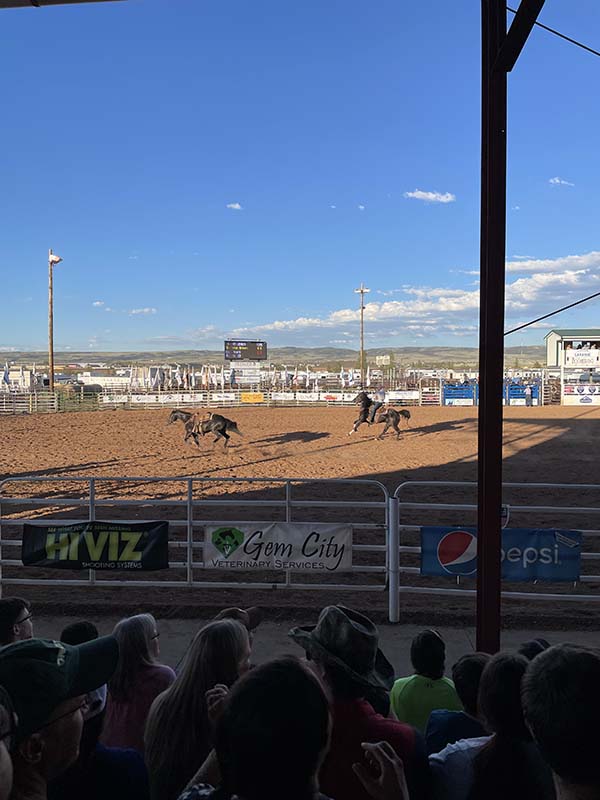 Rodeo festival held once a year in Laramie. During this week, the downtown area is crowded with people enjoying the food stalls and mobile amusement park. |
Lessons from the comparison of the industrial structure of Japan and the U.S.
What I have realized during the internship is the importance of considering both the common challenge of decarbonization and the differences in the political and economic structures of different countries. In the following, I will introduce some of the topics I worked on, including a comparison of the industrial structure of Japan and the U.S. from the perspective of decarbonization.
A major difference in the industrial structure between Japan and the U.S. is that the share of value added by the manufacturing industry in Japan is nearly twice that of the U.S. (Figure 1). While the share of service industries has gradually increased in Japan, the share of manufacturing has not changed significantly over the last 50 years. This relationship is also true in terms of the number of employees (Figure 2). The importance of the manufacturing sector to the Japanese economy is similar at the regional level. In Japan, where natural resources are scarce, the degree of the development of the manufacturing sector has been closely related to the development of each region (Figure 3). In the U.S., on the other hand, no such correlation exists. This indicates the existence of a variety of economic structures, such as states with a high share of service industries, such as California, and states with abundant natural resources, such as Wyoming. These differences in economic structure suggest that decarbonization is an urgent issue for Japan because it has a high proportion of energy-intensive sectors, such as heavy industry. However, it also highlights an urgent problem for U.S. states like Wyoming that have achieved a high standard of living based on an economic structure that will be unable to support the same level of wealth in the future.
Figure 1. Share of Value Added by Economic Activity
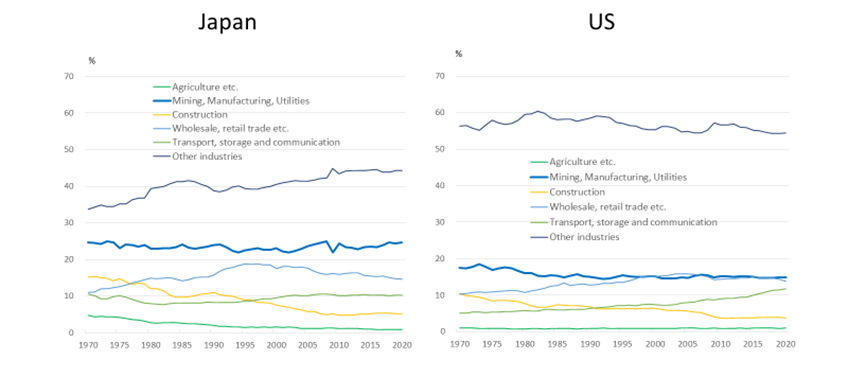
Note: The value added is at constant 2015 prices (US dollars). Source: United Nations
Figure 2: Share of Employment by Industry

Source: Ministry of Internal Affairs and Communications, BEA
Figure 3: The Relationship between Per Capita Income and Manufacturing Share by Prefecture/State

Notes: Japan is based on 2018 FY data. US is based on 2019 data.
The size of the bubbles indicates population size.
Source: Cabinet Office, BEA
The characteristics of energy transition in Japan and the U.S.
What are the characteristics of Japan’s energy transition, with its manufacturing-dependent economic structure? A breakdown of Japan’s CO2 emissions shows that in addition to the energy sector, which is highly dependent on coal- and natural gas-fired power generation, manufacturing industries such as steel and chemicals also account for a considerable share of CO2 emissions (Figure 4). Therefore, in order to promote decarbonization, it is important not only to introduce renewable energy in the power generation sector, but also to reduce emissions in the manufacturing sector.
In the U.S., on the other hand, the transportation sector accounts for a higher share of total emissions (Figure 5). However, since the energy efficiency of the country as a whole is ranked low among developed countries, the industrial sector is also expected to have a large room for emission reduction. Also, the U.S. has a diverse political and economic structure from state to state. For this reason, in understanding U.S. efforts to decarbonize, it is necessary to focus on state-by-state efforts in addition to industry-by-industry efforts.
Figure 4: Composition of CO2 Industry by Emissions in Japan
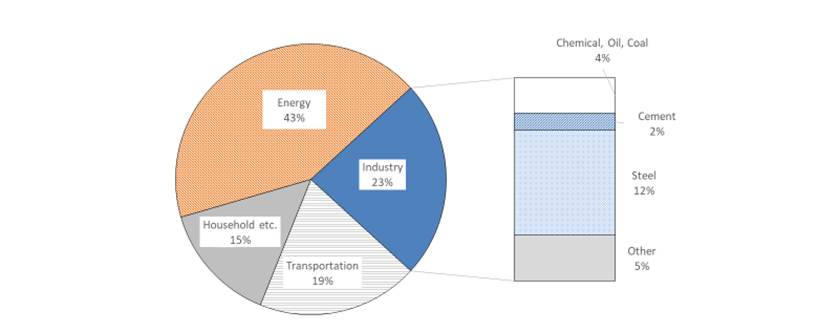
Notes: Based on 2019 data. Source: National Institute for Environmental Studies, Agency for Natural Resources and Energy
Figure 5: Composition of CO2 Industry by Emissions in the U.S.
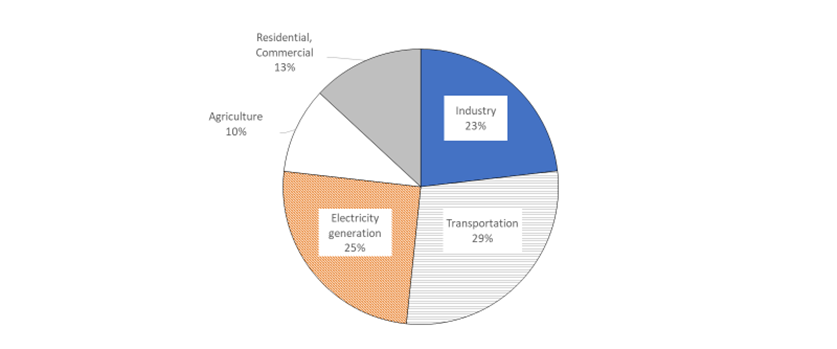
Notes: Based on 2020 data. Source: EPA
Challenges of energy transition
(1) Employment
In Japan, large manufacturing companies are often the agents of change for the energy transition, and unlike in the U.S., layoffs are not common in these companies. Even when older factories are closed in the process of energy transition, employment is generally protected through reassignment within the same company. However, even if layoffs can be temporarily prevented, the sustainability of this response is uncertain, as decarbonization can slow the growth of existing industries. It could also have a negative impact on the country’s overall productivity, as people are less likely to move to growth industries.
On the other hand, in the U.S., start-up activity in the energy sector is stronger due to high job mobility, which would be an advantage in promoting decarbonization. In fact, in Wyoming, start-ups are taking the lead in small nuclear power plants3and hydrogen production projects.4 There are also abundant examples of public policies that support labor migration from declining industries, such as coal, to other industries. For example, the U.S. government set up the “Just Transition Fund,”5 a nationwide effort, and the state of Colorado has extensive support for promoting the labor transition.6 Examining the effectiveness of these policies would be helpful for other regions and countries.
(2) Uncertainty of technological innovation
There are two types of technologies that can enable decarbonization: those that are able to scale today (e.g., wind power) and those that require more development if they are to be both technologically and economically viable at scale (e.g., carbon capture). Successful development of the latter technology would require the investment of a large number of resources to increase the potential for innovation, yet the economic challenges may still not be overcome. A state like Wyoming, which seeks to develop new industries with limited resources, is faced with the difficult decision of how far to invest resources in technological development that involves uncertainty. For example, Wyoming is seeking to host a small nuclear reactor,7 which is scheduled to complete construction around 2030, so long-term strategies are essential. Thus, the energy transition process requires the effective use of limited resources, given the uncertainties of technological innovation.
Personal lessons from the internship
(1) Understand the roles of diverse stakeholders
The implementation of new energy technologies requires coordination with a variety of actors, including federal and state governments, local universities, and the private sector. In the U.S., the stance on decarbonization varies widely from state to state due to the decentralized decision-making under the federal system. Such a U.S. system differs significantly from Japan, where the central government makes comprehensive energy policy decisions. While this decentralized nature has the advantage of allowing some states to quickly adopt progressive initiatives, it also means that the gap with reluctant states widens rapidly, and there is little the central government can do about it. In light of this, the search for appropriate solutions requires an understanding of the institutions and stakeholders that are unique to a country or region.
(2) Accurately identify various constraints
It is not easy to revitalize an economically stagnant region. In every project, the Growth Lab focuses on identifying constraints to growth in various aspects, including demographics, state finances, and transportation infrastructure. This analysis is an important basis for developing growth strategies in the later phases of a project. The process of understanding the historical growth path of a particular region was a useful opportunity to learn the concept of growth diagnosis in the field.
(3) Always looking for potential growth opportunities in the region
What was most impressive to me was that despite the numerous constraints, the Growth Lab researchers were never pessimistic and sought out the unique potential of the region that could be the key to future growth. By effectively combining statistical data with information from experts in various fields and local stakeholders, they were always trying to find clues to growth. I realized that this kind of professional attitude in the development field is important for everyone involved in the public sector.
[1] UW Receives DOE Funding for Carbon Ore, Rare Earth and Critical Minerals Initiatives in Wyoming | News | University of Wyoming (uwyo.edu)
[2] 2020 Wyoming’s Energy Social License Report (uwyo.edu)
[3] Bill Gates’ TerraPower to build its first nuclear reactor in Wyoming coal town (cnbc.com)
[4] Awardees for the Hydrogen Pilot Project – Wyoming Energy Authority (wyoenergy.org)
[6] The Office of Just Transition | Department of Labor & Employment (colorado.gov)
[7] Kemmerer’s locals, leaders eye transition to nuclear-power boom town – WyoFile
African Continental Integration: Lessons from East Africa
By Lucy Luo
The African Continental Free Trade Area (AfCFTA), which came into force in January 2021, is the world’s largest new free trade area since the establishment of the World Trade Organization in 1994. It is expected to facilitate intra-African trade and improve the competitiveness of African industry and enterprises. While there is great momentum behind the agreement, its successful implementation still depends on thoughtful policy choices. In this blog post, we explore what lessons can be drawn from previous regional economic integration experiences.
Economic integration is not new to the African continent. There have been various regional trade blocs, some with overlapping memberships, including the East African Community (EAC), Arab Maghreb Union (AMU), Economic Community of Central African States (ECCAS), Inter-Governmental Authority on Development (IGAD), Economic Community of West African States (ECOWAS), Community of the Sahel-Saharan States (CEN-SAD), Common Market of Eastern and Southern Africa (COMESA), and the Southern African Development Community (SADC). The EAC is one of the oldest customs unions and has been ranked the most integrated regional economic community. Kenya, Tanganyika, and Uganda had a customs union as far back as 1927 under British colonial rule. The EAC was relaunched by the three newly independent states in 1967, has since collapsed in 1977, and was reestablished again in 2000. Today, the EAC consists of seven partner states: The Democratic Republic of the Congo, the Republics of Burundi, Kenya, Rwanda, South Sudan, Uganda, and the United Republic of Tanzania (Exhibit 1).
Given the region’s almost hundred years’ history of integration and disintegration, what lessons can we learn from East Africa that can inform the successful implementation of the AfCFTA?
Exhibit 1: East African Community (EAC) Partner States, 2022
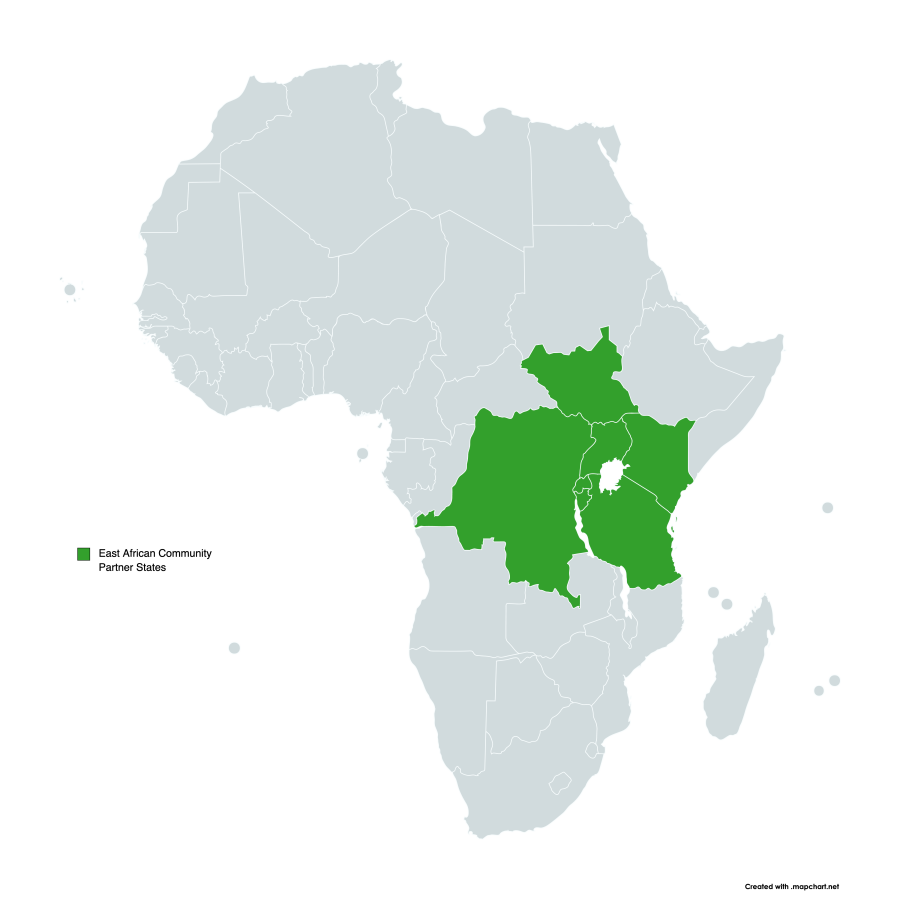
Source: EAC
Lesson 1: Alignment of political will is essential
It should not be a surprise that a successful trade bloc requires genuine political will from all member states. EAC’s collapse in 1977 came after a multi-year deadlock in its highest governing body, the East African Authority, consisting of the presidents of the three founding countries: Kenya, Uganda, and Tanzania. Starting in 1971, the Authority never convened, mainly because of the deteriorating relationship between President Julius Nyerere (TZA) and President Idi Amin (UGA) after Amin installed a coup to overthrow President Milton Obote, who had close ties with Nyerere. The conflict eventually culminated in the Uganda-Tanzania War in 1978.
More than personal clashes, ideological divergence was significant in the region, especially in the context of the Cold War. Tanzania had set a socialist and self-reliant policy agenda since 1967 and received aid and technical assistance from Beijing, while Kenya emphasized private, largely foreign, investments (from Europe and the US). The EAC, however, assumed that advantages of integration would come from free trade, with economic activities conducted by private enterprises and sufficient financial liquidity. The clash of ideologies affected foreign policy and relations, leading to Tanzania eventually closing its border with Kenya in 1977.
This is not to say that states and their leaders must share the same policy agenda or ideology. Rather, for a trade bloc to succeed, states at minimum need to maintain peaceful and stable relations while agreeing on the advantages of integration and the principles of free trade. Moreover, when divergence of views or interpretations arises, there should be mechanisms in place for dialogues that facilitate problem-solving and conflict resolution. These factors were lacking in the first iteration of the EAC.
Lesson 2: Imbalanced trade and distribution can threaten integration
The lack of political alignment was not the only obstacle to East African integration. Economically, not all member states benefited from the EAC equally. Tanzania and Uganda’s trade deficits increased during the first EAC, almost entirely attributable to the growing net importation of manufactured goods from Kenya. In fact, Ugandan exports in absolute value declined continuously after 1970. By contrast, Kenya’s trade share in the EAC increased continuously. Kenya’s exports were divided almost evenly between Tanzania and Uganda, whereas both Tanzania and Uganda traded mostly with Kenya as their economies were heavily dependent on importing manufactures. This demonstrates that free trade did not substantially change patterns of production between the three countries, as a tariff was not the binding constraint for specialization in production. Tanzania and Uganda still produced a similar range of primary products over time.
Such distributional effects are not entirely surprising. What is important for a trade bloc to sustain is to compensate for the unequal benefit distributions. The first EAC intended to build in mechanisms “to correct the imbalance in industrial development.” The East African Development Bank (EADB) charter stipulated 38.75% of EADB investments should be made to Tanzania and Uganda and only 22.5% to Kenya. However, compliance only went so far as loan approvals and not actual disbursements. Tanzania ended up with 39.2% of the loans, followed by Kenya with 34.5% and Uganda with 26.3%. These imbalances likely contributed to the collapse of the first EAC.
When we look at the product mix that are traded between the three countries today, similar dynamics persist, in which Tanzania and Uganda export mainly primary products to Kenya (Exhibit 2).
Exhibit 2: Tanzania and Uganda’s export product mix to Kenya, 2019

Source: The Atlas of Economic Complexity, Harvard’s Growth Lab
The second iteration of the EAC also did not seem to have structurally reoriented trade towards more intraregional trade, either (Exhibit 3). Why, then, does integration make sense for countries other than Kenya?
Exhibit 3: Intra-regional trade growth was part of a general increase, not a structural reorientation
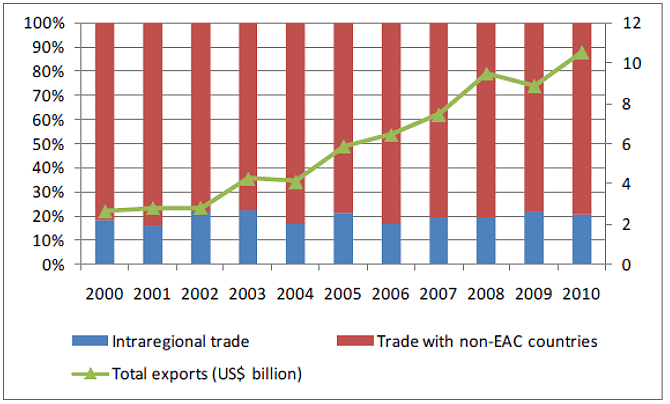
Source: ECDPM Discussion Paper No.186
There has been literature suggesting that welfare gains from integration are mostly from a reduced common external tariff rather than more intraregional trade. This is confirmed by empirical evidence from the European Union (EU), where extra-regional trade had more impact on growth than intra-regional trade. As a trade bloc, all members benefit from having more negotiating power against external trading partners or unions. Therefore, states and their leaders need to consider not only intraregional trade but also interregional dynamics to fully assess the benefits of integration.
In sum, even though regional integration may have imbalanced distributional consequences, the consideration of trade and negotiations with external actors may outweigh the disadvantages brought by the former. In addition, a trade bloc can build in mechanisms that compensate for the unequal distributional effects. However, it is important to have checks and balances within the governance structure to ensure that these mechanisms are properly implemented.
Lesson 3: Monitor non-tariff barriers
Even within a well-established trade bloc where tariffs are eliminated, non-tariff barriers (NTBs) can be significant. Within the EAC, while various customs and trade facilitation measures1, as well as tax-like measures2, have been resolved, many still persist. Additional NTBs include quality and safety standards and import bans (Exhibit 4).
Exhibit 4: Resolved and unresolved non-tariff barriers within the EAC, 2016
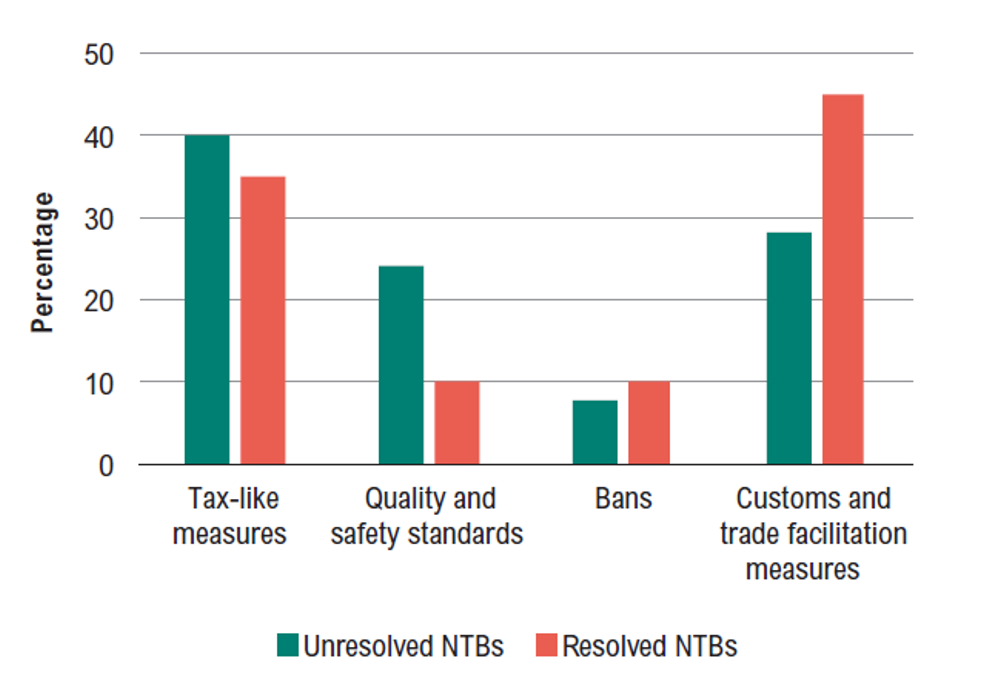
Source: ODI, 2016
When there is a lack of political will for integration, the benefits of eliminating tariffs may well be offset by the introduction of NTBs. Calo-Blanco and Naya (2006) found that governments of economically integrated countries tend to replace tariffs with NTBs when their priority is to protect the nation’s firms.
NTBs are at least three times more restrictive than regular customs duties, as the United Nations Conference on Trade and Development (UNCTAD) estimates. Various empirical studies have found reducing NTBs, such as improving infrastructure and institutions, potentially has far larger gains than lowering tariff barriers. An UNCTAD report suggests that African countries could gain US$ 20 billion in GDP growth by tackling such NTBs at the continental level.
Therefore, it is important to monitor and establish mechanisms for resolving NTBs for a trade bloc to be truly welfare-enhancing. The EAC recognizes this and has taken important steps to eliminate existing and avoid new NTBs. In 2009, the EAC agreed to establish a Monitoring Mechanism of NTBs, and the Secretariat was tasked with maintaining a regularly updated inventory list of resolved and unresolved NTBs. The EAC subsequently enacted the EAC Elimination of Non-Tariff Barriers Act of 2017 to provide a legal framework for monitoring and addressing NTBs in the region. While there has been progress in eliminating NTBs, the Committee on Trade Remedies, which determines compensation for NTB-related losses, is not yet operational due to political stalemate. This again highlights the importance of political will as a prerequisite for integration.
As the AfCFTA came into effect, it has also created an online mechanism for reporting, monitoring and eliminating NTBs, which has been operational since 13 January 2020. NTB complaints submitted online are sent to formally nominated government officials (National Focal Points) who monitor and eliminate the barriers. However, the EAC experience tells us that having a monitoring mechanism alone may not ensure execution. Transparency and awareness will help, but there needs to be sufficient political will among the governments to ultimately resolve NTBs.
Drawing from these three lessons from EAC’s experience, I would recommend the following key considerations for AfCFTA to have a higher chance of success:
- Build in mechanisms to facilitate problem-solving and conflict resolution to avoid political stalemate between states.
- Individual states should consider not only trade within the region but also the trade bloc’s external dynamics before deciding how willing they are to cooperate with each other.
- Continue building in mechanisms to compensate for the unequal distributional effects of a trade bloc, such as via the African Development Bank. More importantly, build in checks and balances within the governance structure to ensure that these mechanisms are properly implemented.
- Continue monitoring and publicizing non-tariff barriers and tracking the progress for their elimination.
- Provide a legal framework to address NTBs and ensure that it can be operational (use the abovementioned conflict resolution mechanism if necessary).
1 Cost-increasing measures incurred as a result of the monitoring and enforcement of trade facilitation and customs rules (excluding the enforcement and monitoring of standards and quality and safety measures).
2 Measures that impose monetary costs on imports (including non-application of preferential tax arrangements).
Student Stories: Inspired by the Growth Diagnostics Framework

Jack Gisby recently graduated with an MPA (Economic Policy) from the London School of Economics. As part of the Growth Lab’s 2022 Summer Internship Program, he contributed to the newly formed Pan-Africa research agenda. Our team is exploring the Africa Continental Free Trade Area (AfCFTA) and the underlying constraints that have held African nations back from economic diversification and structural transformation.
Why did you apply to be a Growth Lab intern?
Taking the growth diagnostics course with Miguel Santos was a highlight of my time at the LSE. It was quickly apparent that the diagnostic framework provides analysts with a unique ability to identify and understand the material factors that are impacting the growth trajectory of a developing economy. I wanted to work at the Lab to expand my understanding of how the framework can be applied to different contexts and to gain additional experience conducting the underlying analysis.
What did you work on this summer?
I’ve spent my time trying to understand the ways in which the African Continental Free Trade Agreement could potentially transform the continent’s economic environment and enable African countries to engage in more complex and valuable aspects of production. In this pursuit, I’ve reviewed literature, attended conferences, interviewed stakeholders from the public and private sector, and conducted independent analysis.
In what ways were you challenged?
Given the excitement surrounding the AfCFTA, as well as the scope of the agreement, there has been an enormous amount of literature written about it over the last five years. At times, it’s been challenging to cut through the sheer volume of information to identify credible and novel insights that are relevant to the Growth Lab’s approach.
What was your most exciting/surprising experience?
The opportunity to work on an independent blog post derived from the research that I’ve done with the Lab has been particularly enjoyable – the flexibility and autonomy offered by my team has been empowering.
What advice would you give future Growth Lab interns?
1) Be proactive in reaching out to your manager, team, and other project teams to express your interest in specific topics. 2) Start thinking about topics that you might want to write about as early as possible.
What’s next for you?
I will continue working at the World Data Lab, focusing on the design and management of development-focused research projects in Africa. I will also begin working at the International Growth Centre based at the LSE, within the newly created Tax4Growth Initiative – again, with a geographic focus on Africa. Given that both roles have a strong focus on Africa’s economic development, I have no doubt my learnings within the AfCFTA project team will be relevant and valuable.
Student Stories: Tackling Transportation Infrastructure in Kazakhstan

Yomna Mohei Eldin is a second-year MPA/ID student at Harvard Kennedy School. She was accepted into the Growth Lab’s 2022 Summer Internship Program and contributed to our policy engagement in Kazakhstan where our research aims to identify and prioritize investment opportunities and policy options to drive sustainable economic growth and diversification.
Why did you apply to be a Growth Lab intern?
I applied to the Growth Lab internship because I believe that it would be an essential cornerstone of my MPA/ID experience and my interest in international finance and trade.
What did you work on this summer?
I worked on researching policy solutions for stagnant corporate credit growth in Kazakhstan and on studying the transportation infrastructure sector. My work also included meeting with businessmen, researchers, and government officials in Kazakhstan to discuss our diagnostics and policy recommendations.
In what ways were you challenged?
This project was my first exposure to the central Asia region; thus, it was challenging and exciting to learn about a new region and a new project within the span of 8 weeks. Given that I had only worked in Egypt before going to HKS, it was a challenge to avoid my unconscious confirmation bias of linking problems in Kazakhstan with those I have seen before in Egypt. However, it was an exciting experience to fight these unconscious biases and focus on the unique economic environment of Kazakhstan.
What was your most exciting/surprising experience?
The most exciting experience was staying in Astana for a month. It was very exciting to see first-hand the unique culture and development efforts of the country.
What advice would you give future Growth Lab interns?
I would advise them to aim for a project in an unfamiliar region.
What’s next for you?
The internship has further increased my interest in international finance and trade, and I hope to continue working on these topics after graduating from the MPA/ID program.
Student Stories: Assessing Decarbonization (and the Rodeo) in Wyoming

Ryosuke Shimizu is a second-year MPA/ID student at Harvard Kennedy School. He was accepted into the Growth Lab’s 2022 Summer Internship Program and contributed to our policy engagement in Wyoming. Initial work will focus on understanding the causes of economic stagnation that have resulted in a deficit of job opportunities. We will also examine the risks and opportunities for the future of Wyoming’s economy, including automation and global decarbonization.
Why did you apply to be a Growth Lab intern?
The Wyoming project is a unique opportunity to analyze an economically stagnant region in a developed country. What I found very interesting is that the project also focuses on the impact of decarbonization trend on local economies. I thought that learning about the role of public policy in the energy transition process would be a great experience for my future career in the public sector.
What did you work on this summer?
I conducted research about Wyoming’s energy strategy in response to decarbonization and the latest demonstration projects being conducted in Wyoming (e.g., rare earth extraction technologies). I also assisted a researcher at the University of Wyoming in writing an economic analysis report.
In what ways were you challenged?
In order to understand the current state of the energy transition process in the U.S., it was necessary to research a wide range of topics, including various energy technologies and federal/state government policies.
What was your most exciting experience?
I watched the rodeo festival held once a year in the town where I was staying in Wyoming. It was exciting to experience the essence of western culture in the U.S.
What advice would you give future Growth Lab interns?
I recommend examining the project topic in advance and choosing a project in your area of interest.
What’s next for you?
Energy transition has become a common challenge for governments around the world. I would like to use the knowledge gained through this project in my future research activities in public organizations.