What we learn from WAEMU for regional integration on the African continent
By Julia Conrad
Created in 1994, the West African Economic and Monetary Union (WAEMU) was established as a trade and currency union and encompasses the eight countries Benin, Burkina Faso, Côte d’Ivoire, Guinea-Bissau, Mali, Niger, Senegal, and Togo1– all of which are equal members of the regional and economic union ECOWAS, the Economic Community of West African States.2 The adoption of a common currency among states is regarded as one of the highest forms of economic integration.3 Literature suggests that the establishment of a monetary union leads to increased economic activity through a rise in trade or investment flows between member countries and higher macro-economic stability.4,5, 6
WAEMU as an economic union emerged from colonial arrangements. Critics also describe it as “colonial relic” that is meant to preserve the dominance of Paris and French companies in West Africa.7 It was initially aimed at reducing transaction costs, facilitating the free movement of persons, goods, services, and capital among its members.8 The IMF and some global bodies have consistently described WAEMU as successful regional bloc with a high level of economic integration.9,10 Our analysis at the Growth Lab has found little evidence for this assessment. In contrast, it seems that many critics are right in pointing towards worrying low levels of trade and investment across the bloc. They claim that low inflation can be regarded as WAEMU’s single achievement, and even then, the question remains whether anti-inflationary governance is appropriate in the development context of Africa.11
Four working principles are at the core of WAEMU: (1) a peg of its exchange rate to the French currency, (2) free income and capital transfers within the zone and with France, (3) the French treasury promises to lend euros to the Central Bank of West African States bank (BCEAO) if they exhaust own foreign exchange reserves (this “convertibility guarantee”), and in return (4) the BCEAO must deposit at least 50% of its foreign currency reserves in a special ‘operations account’ of the French treasury – a condition that was finally lifted in 2019.12
All Euro-XOF (CFA franc) conversions used to pass through this operations account. When it was in credit, the French treasury paid interest and when it was in debit, the guarantee was active – a scenario that only happened back between 1980-1993. A French representative also used to sit on the board of the BCEAO, but this was recently also changed.13,14 The experience of WAEMU has even animated ECOWAS leaders to envisage the implementation of the currency “Eco” across the whole of West Africa, but its launch has been repeatedly postponed, last in 2020.15 A Pan-African monetary union was also part of earlier AfFCTA discussions. Its vision was partly realized under the introduction of a Pan-African Payments and Settlement System (PAPSS) in early 2022.16
“CFA franc” is essentially the name of the only two currency unions on the African continent under the West African CFA franc (XOF) and the Central African franc (XAF). Although separate, the two currencies have always been at parity and are effectively interchangeable.17 Our analysis focused on the West African CFA franc to understand what the integration under one monetary system has meant for its members’ economic stability and regional economic activity. A special focus was on the question of whether integration has led to the promise of increased levels of regional trade or investment, similar to what has been observed among member countries after the establishment of the EU.18 We also looked at how WAEMU compares in these areas with other regional economic communities (RECs) on the continent.
ON WAEMU
WAEMU consists of eight relatively small states with similar market structures of which all but Guinea Bissau (Portuguese) share French as an official language.19 Some annual economic statistics of WAEMU’s member countries (before Covid-19) are summarized in the table below.
Table 1: Overview of WAEMU member countries
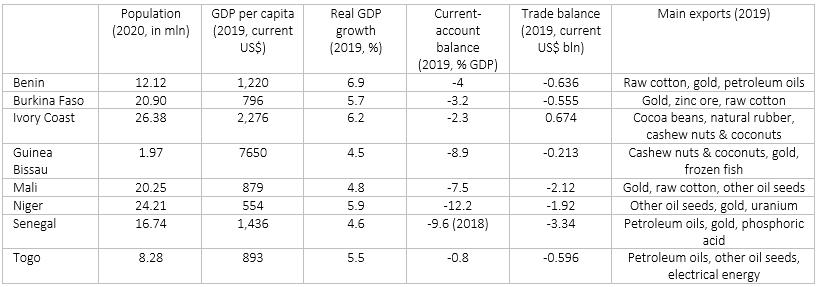
Source: World Bank Database, Atlas of Economic Complexity
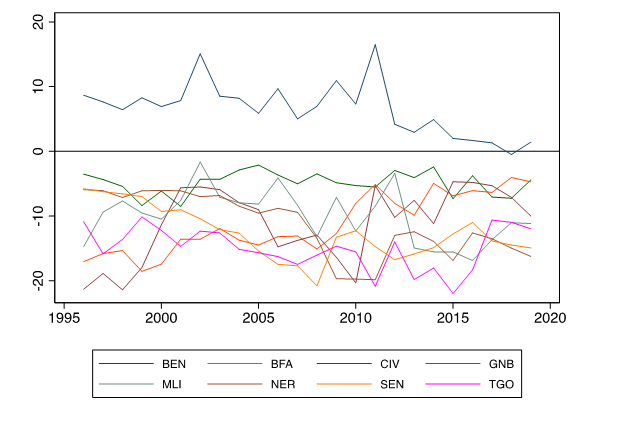
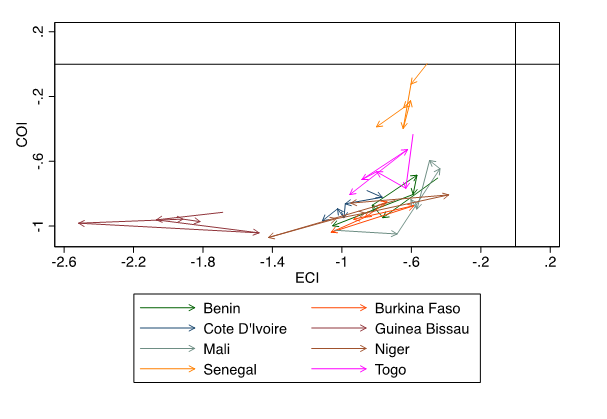
Apart from Ivory Coast, member states’ trade balance over the past 20 years has been consistently negative (see Graph 1). WAEMU states also perform relatively poor on Economic Complexity measures, as captured by the Economic Complexity Index (ECI) and Complexity Outlook Index (COI) in Graph 2. The ECI summarizes a country’s capabilities as regards production possibilities while the COI reflects the availability of good diversification opportunities for its export basket. The graph shows that WAEMU states have remained within the negative ECI and COI zone indicating little space to improve and few opportunities for economic diversification. For most WAEMU countries, the arrows also direct to the lower left of the graph, meaning that countries have become even less complex between 2015-19.
Graph 1: Trade balance of WAEMU countries from 1996-2019
Graph 2: ECI and COI evolution of WAEMU countries between 2015-2019
COMPARISON WITH OTHER RECS
We compared WAEMU’s export structure with other RECs on the continent to see if there was any visible impact of sharing the CFA franc as currency on trade. The following table gives an overview of the selected RECs.
Table 2: Overview of RECs included in the Analysis
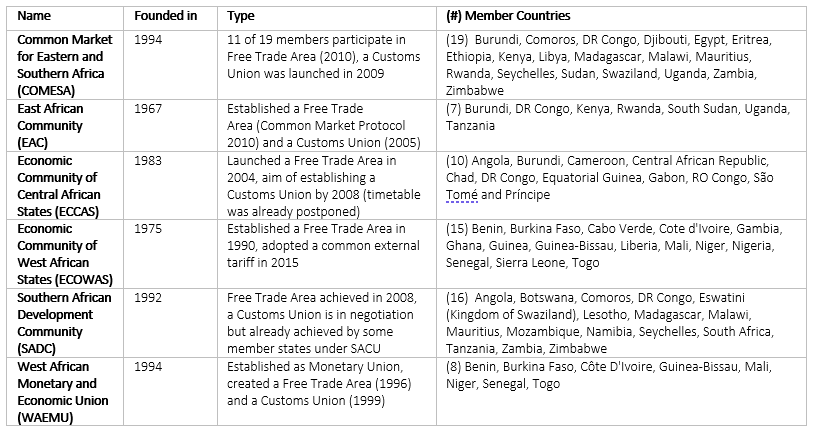
Note: RECs in Africa that are not included are The Community of Sahel–Saharan States (CEN-SAD), The Intergovernmental Authority on Development (IGAD), The Arab Maghreb Union (AMU) and The Southern African Customs Union (SACU). All information is based on own desk research.
As regards the economic development level, SADC, COMESA and ECCAS show a higher average income level, reaching a GDP per capita (current $) of over $2,500 GDP in 2019.20 For ECOWAS, WAEMU and EAC it was below $1,500. Unemployment has been especially high among SADC states (above 10% on average since 1999) while it was lowest (below 5%) in EAC and WAEMU. Average Inflation in WAEMU has been relatively low and remained below 5% since 2010. Since 2010 external debt in all RECs has been rising. The government’s debt burden was highest in COMESA, ECOWAS and EAC in 2019, with average debt levels of above 50%.
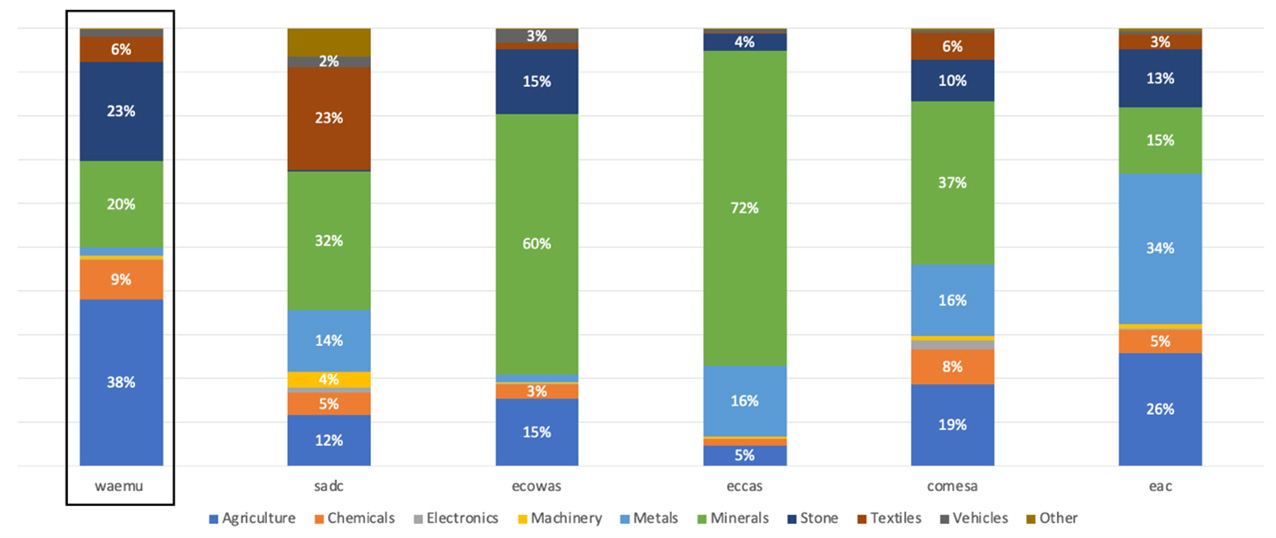
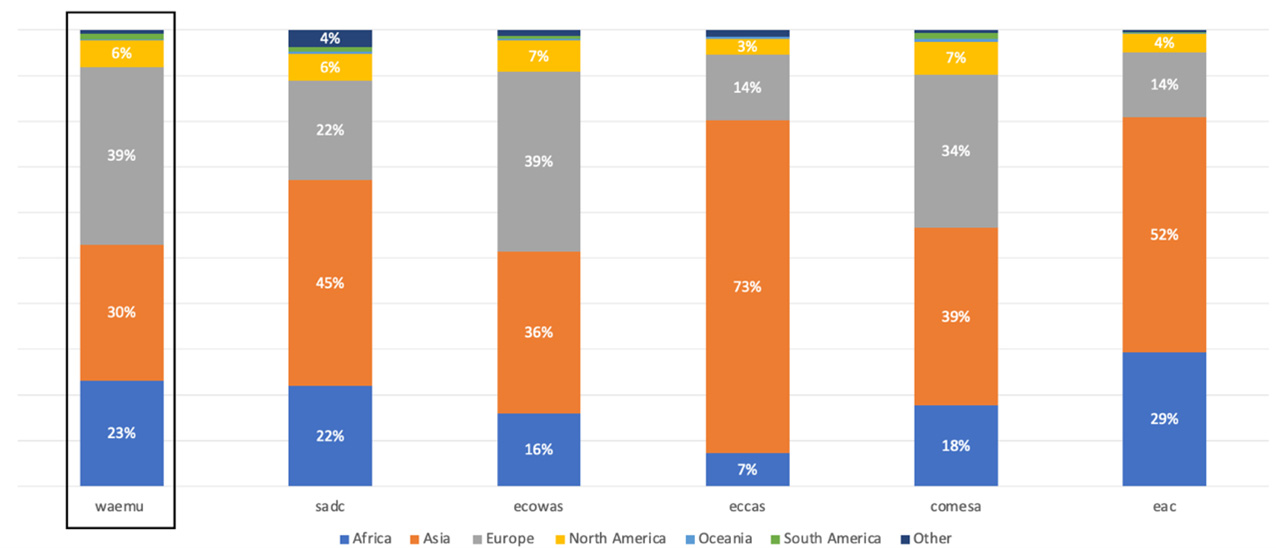
The composition of export baskets varies but it is in all RECs dominated by minerals, non-transformable commodities, and agricultural products, which are not integrated in regional supply chains and are hence shipped abroad (see Graphs 3 & 4). Exports in ECOWAS and ECCAS have mainly (>=60%) consisted of minerals. Minerals export in SADC and COMESA has been less significant but was still high (~1/3). In WAEMU, agricultural products (cocoa, raw cotton, cashew, and cocoa nuts) dominate the export basket, followed by stones (primarily gold). Interestingly, WAEMU also has the highest share of chemical products that is exported (Senegal, for example, exports 8% of the world’s phosphoric acids used in fertilizers21 ). With $9.6 billion in total export value in WAEMU and $38.5 billion in ECOWAS, Europe remains the primary trade destination in West Africa, accounting for 39% of all exports in both RECs. For East and South African blocs, Asia has overtaken Europe as the primary export destination. In ECCAS, Asia makes up as much as 77% of all exports. With 29% the EAC has had the highest share of exports within the African continent.
Graph 3: What did RECS export in 2019?
Graph 4: Where did RECS export to in 2019?
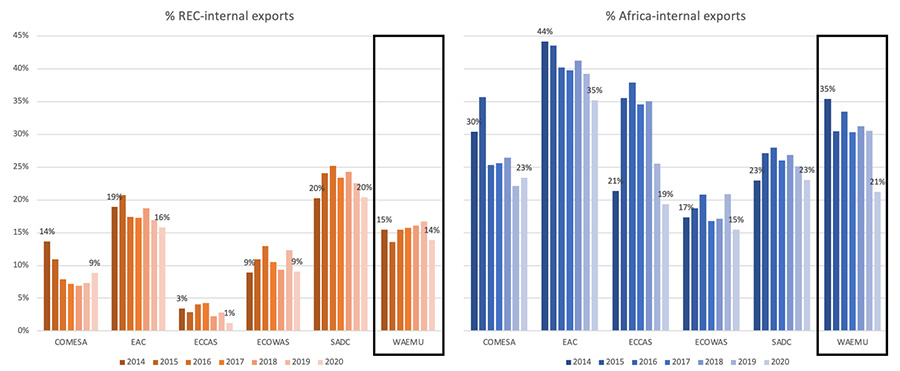
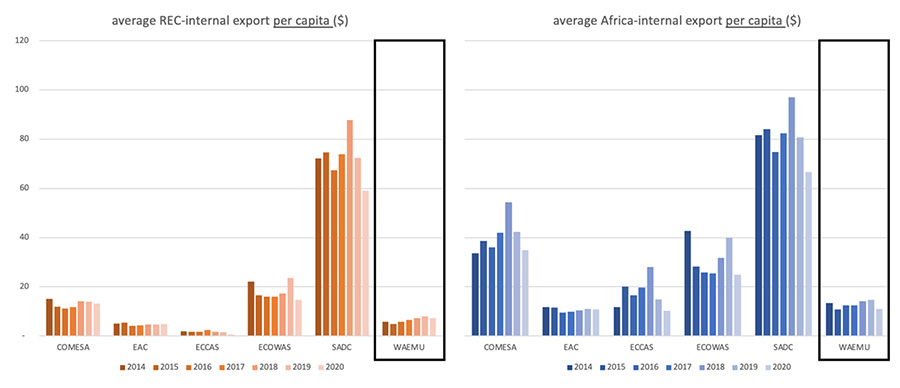
Graph 5 compares the share of regional, which means REC-internal and Africa-internal, exports for the period 2014 to 2020. Community-internal export was highest among SADC and EAC countries, with 20% and 16% of internal exports in 2020 respectively. Despite the promise of facilitated trade through a common currency, WAEMU’s internal trade business did not stand out, neither REC-internally nor for exports to the continent, and it was mainly reliant on refined oil. It was equally low in per capita terms, in contrast to SADC for example.
Graph 5: Regional exports 2014-2020
Graph 6: Regional FDI flows 2003-2019
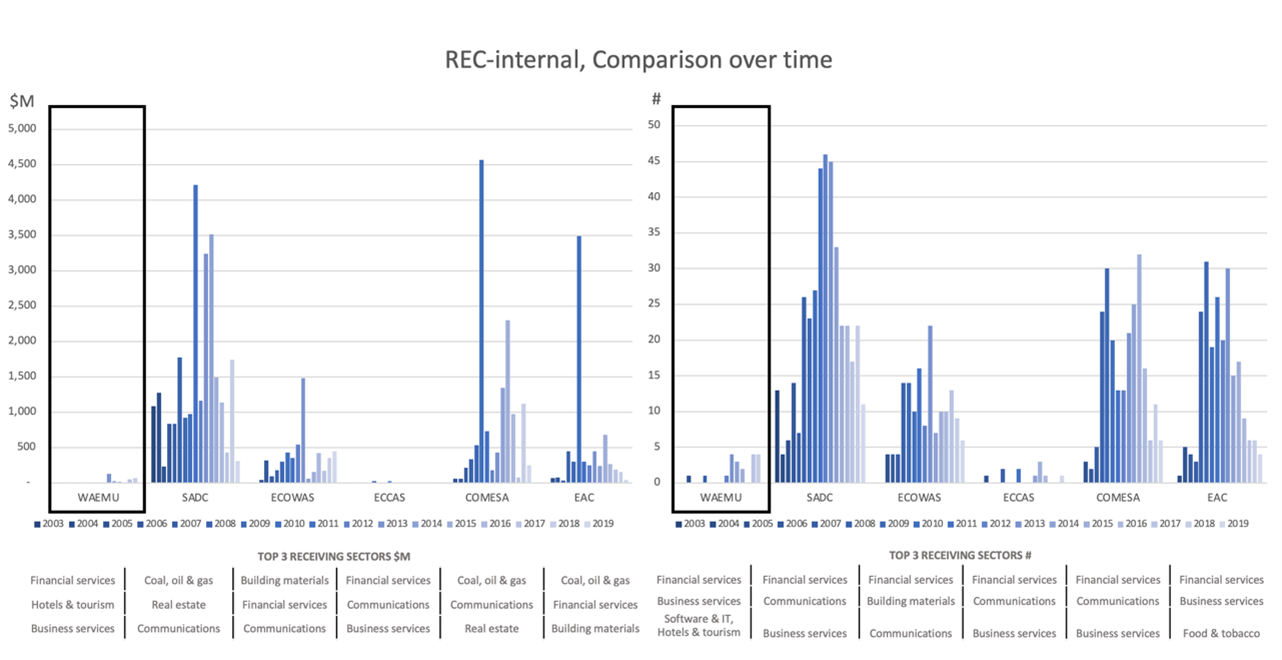
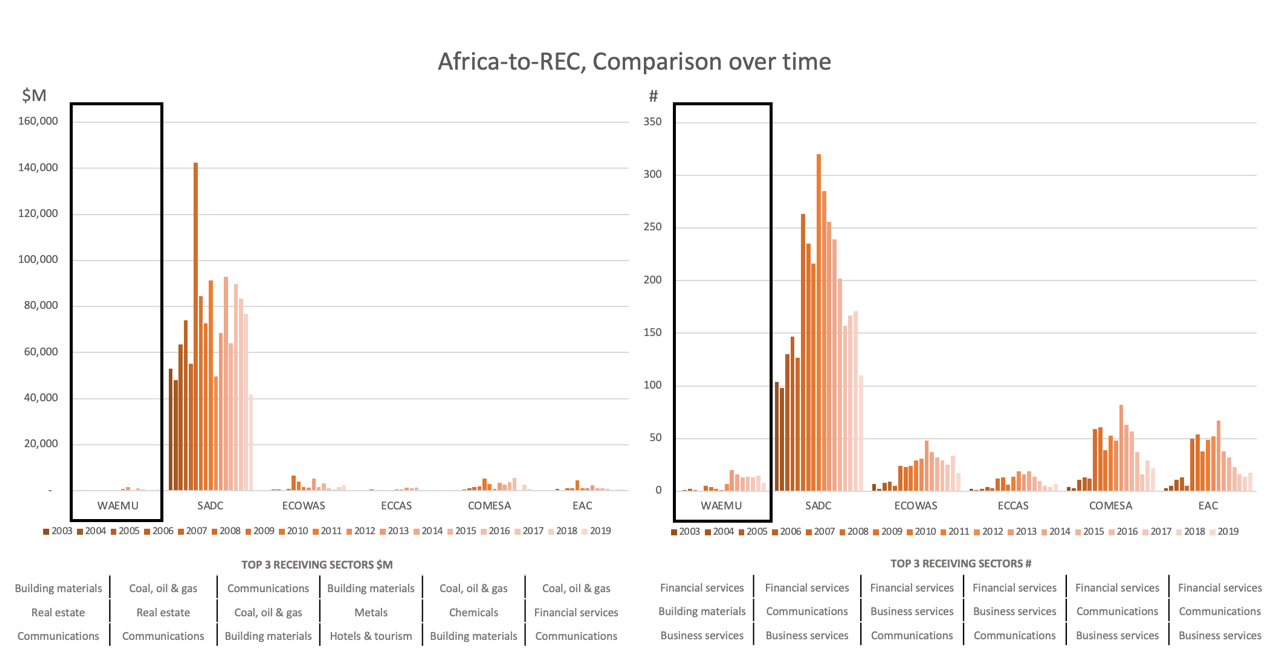
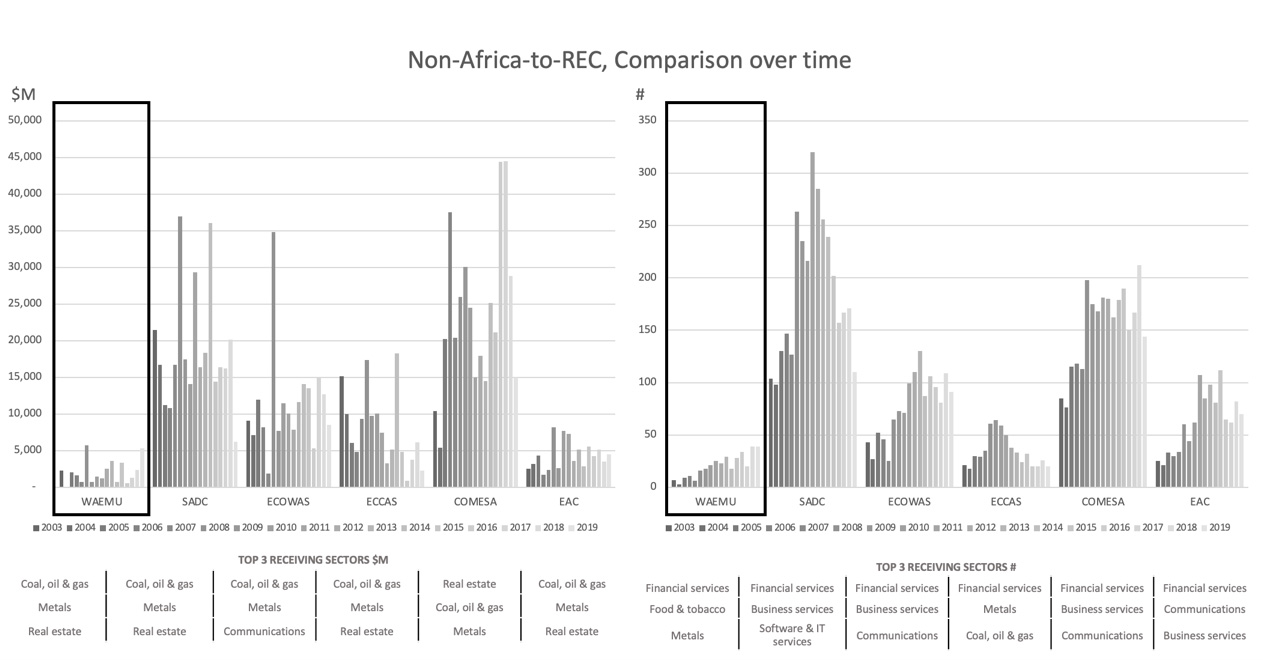
Note: Calculations are based on investment deal announcements as captured by fDi Markets.
WAEMU has similarly not attracted more bloc-internal investment (Graph 6). Between 2003-2019, the group’s internally announced deals were only a small fraction (<10%) of the deals within EAC, which is a grouping of a similar size. REC-internal announcements were most frequent in SADC where almost 400 projects of more than $25 billion were planned. WAEMU lags similarly behind in generating investments from the continent as a whole. Again, investors’ interest was concentrated in SADC where more than 3,200 deals of $1.25 trillion from Africa were reported. Interestingly, the volume of capital inflow from outside Africa focused on COMESA. Across all RECs, investments centralized in the financial and business services sectors (as reflected by # of deals) while the coal, oil, gas, and metals sectors received the most capital.
MAIN TAKEAWAY
The experience of WAEMU shows that the formal establishment of a free trade (and single currency) regime alone does not automatically imply an increase in economic activity across member countries. We found that WAEMU-internal and Africa-wide trade has remained relatively limited. This is likely because other serious barriers continue to exist beyond those impacted by trade terms and a shared currency, including the well-documented lack of necessary logistical networks, and streamlined procedures for customs in the region. The insecurity in border areas, for example in Eastern Burkina Faso’s area close to Togo and Benin, has also become a major concern that is hindering smooth transportation in the area22. It is commendable that regional communities and trade facilitation agreements have formed and continue to exist across the continent. But these agreements are not sufficient to increase trade and investment on their own. This is true for both internal trade and investment within the community and the ability of the community to attract transformative business investment from outside. This suggests that larger trade agreements like AfCFTA may lead to limited impact only if negotiated policies and terms that aim to facilitate trade and capital flows lack a system of strict enforcement and external circumstances, such as infrastructure and security, remain unfavorable23.
Julia Conrad is currently pursuing a Master in Public Administration degree at Harvard Kennedy School (2023). Previously, she worked for five years at the International Finance Corporation (World Bank Group) in Dakar (Senegal), where she managed a portfolio of micro- and agriculture finance projects across Africa. Her studies at Harvard have focused on Infrastructure Development, Development Policy, and Climate Change. She also has a BSc in International Economics from the University of Tuebingen and a MEc in World Economics from the University of Finance and Economics in Shanghai.
———————–
1Website of the West African Economic and Monetary Union. “About UEMOA.” http://www.uemoa.int/en/about-uemoa(last visited: 23 July 2022)
2Website of the Economic Community of West African States. “Member States.” https://ecowas.int/?page_id=381 (last visited: 23 July 2022)
3 Britannica Online Encyclopedia. “Economic Integration.” https://www.britannica.com/topic/economic-integration(last visited: 23 July 2022)
4 Frankel, Jeffrey A. & Andrew K. Rose. “Estimating the Effect of Currency Unions on Trade and Output.” Quarterly Journal of Economics CXVII, 2 (May 2002): 437-466. https://www.nber.org/papers/w7857(last visited: 23 July 2022)
5Glick, Reuven & Andrew K. Rose. “Does A Currency Union Affect Trade? The Time-Series Evidence.” European Economic Review, 2002, v46 (6 June): 1125-1151. https://www.nber.org/papers/w8396 (last visited: 25 July 2022)
6 Micco, Alejandro, Ernesto Stein, Guillermo Ordoñez, Karen Helene Midelfart & Jean-Marie Viaene. “The Currency Union Effect on Trade: Early Evidence from EMU.” Economic Policy 18, no. 37 (2003): 317–56. http://www.jstor.org/stable/1344738 (last visited: 25 July 2022)
7 Pilling, David. “A revolution in Africa’s relations with France is afoot.” Financial Times. 31 December 2019. https://www.ft.com/content/8894ad6e-2650-11ea-9a4f-963f0ec7e134 (last visited: 25 July 2022)
8 Website of the West African Economic and Monetary Union. “The Amended Treaty.” http://www.uemoa.int/en/amended-treaty(last visited: 25 July 2022)
9 Ouattara, Alassane D. “The West African Economic and Monetary Union (WAEMU) – Facing the Challenges of the Future.” IMF. 30 June 1998. https://www.imf.org/en/News/Articles/2015/09/28/04/53/sp063098(last visited: 25 July 2022)
10Pangea Risk. “Special Report: Africa’s Common Markets Compete for Trade and Investment.” 8 March 2021. https://www.pangea-risk.com/wp-content/uploads/2021/03/SPECIAL-REPORT-AFRICAS-COMMON-MARKETS-COMPETE-FOR-TRADE-AND-INVESTMENT.pdf(last visited: 25 July 2022)
11Samba Sylla, Ndongo. “Moving forward to African Monetary Integration.” Africa Development/Afrique et Développement, 2020, Vol. 45, No. 2 (2020): 39-58. https://www.jstor.org/stable/26979255(last visited: 25 July 2022)
12 Pilling, David. “A revolution in Africa’s relations with France is afoot.” Financial Times. 31 December 2019. https://www.ft.com/content/8894ad6e-2650-11ea-9a4f-963f0ec7e134(last visited: 25 July 2022)
13Mieu, Baudelaire. “France begins transfer of €5bn to BCEAO as part of CFA franc reform.” The Africa Report. 5 May 2021. https://www.theafricareport.com/85566/france-begins-transfer-of-e5bn-to-bceao-as-part-of-cfa-franc-reform/ (last visited: 25 July 2022)
14 Wilson, James. “The CFA franc reforms are more symbolic than transformative.” LSE Blog. 19 March 2020. https://blogs.lse.ac.uk/africaatlse/2020/03/19/cfa-franc-reforms-monetary-policy-symbolic-colonialism/ (last visited: 25 July 2022)
15 Mugabi, Isaac. “West Africa’s Eco currency plan remains a pipe dream.” Deutsche Welle (DW). 2 July 2021. https://www.dw.com/en/west-africas-eco-currency-plan-remains-a-pipe-dream/a-58136111 (last visited: 25 July 2022)
16Ogbalu, Mike III. “Boosting the AfCFTA: The role of the Pan-African Payment and Settlement System.” Brookings. 11 February 2022. https://www.brookings.edu/blog/africa-in-focus/2022/02/11/boosting-the-afcfta-the-role-of-the-pan-african-payment-and-settlement-system/ (last visited: 25 July 2022)
17 Wikipedia. “CFA franc.” https://en.wikipedia.org/wiki/CFA_franc#cite_note-2020_nzaou_kongo-1 (last visited: 25 July 2022)
18Daan Freeman, Dean, Gerdien Meijerink & Rutger Teulings. “Trade benefits of the EU and the Internal Market.” CPB Netherlands Bureau for Economic Policy Analysis. January 2022. https://www.cpb.nl/sites/default/files/omnidownload/CPB-Communication-Trade-benefits-of-the-EU-and-the-Internal-Market.pdf (last visited: 25 July 2022)
19Website of the BCEAO. “Member States.” https://www.bceao.int/en/etats-membres (last visited: 25 July 2022)
20One must note that differences of income level are enormous REC-internally. For example, in COMESA and SADC, the Seychelles’ GDP per capita (current $) was more than 34-times that of Mozambique. In ECCAS, Equatorial Guinea’s per capita GDP was even than 37-times that of Burundi.
21Retrieved from The Atlas of Economic Complexity. The Growth Lab. Harvard Kennedy School of Government. https://atlas.cid.harvard.edu/explore?country=undefined&product=5895&year=2019&productClass=HS&target=Product&partner=undefined&startYear=undefined (last visited: 25 July 2022)
22 Salau, Sulaimon. “Poor infrastructure, insecurity hinder cross-border trade.” The Guardian. 8 May 2022. https://guardian.ng/business-services/poor-infrastructure-insecurity-hinder-cross-border-trade/(last visited: 25 July 2022)
23USAID. “West Africa Regional: Economic Growth and Trade.” Last updated 21 July 2022. https://www.usaid.gov/west-africa-regiona/economic-growth-and-trade (last visited: 25 July 2022)
A Free Trade Agreement Across the African Continent: Where Are the Export Opportunities for Nigeria?
After being fully implemented, the African Continental Free Trade Area (AfCFTA) is going to be the biggest Free Trade Agreement (FTA) ever in population and geographical size: more than fifty countries have been working since 2015 on tariff reductions in goods, rules of origin and procedures, technical barriers, or trade-in services, just to mention some topics. Considering that intra-regional trade is only 17% of total African exports (compared to 59% in Asia or 69% in Europe)1, this FTA could be a big step toward the goal of increasing exports (including diversification and more complex products) between African countries.
However, if we want to know where the export opportunities for a particular country are, it is hard to know where to start. The Agreement includes and addresses so many topics and issues that are easy to get lost. For instance, what are the binding constraints to intra-regional trade in practice and how is the AfCFTA going to impact them? Are those binding constraints the same for every sector in each country? What is the current situation in terms of tariffs and non-tariff barriers and how is that going to change?
I spent eight weeks trying to find an answer to these questions for Nigeria as part of a research sprint with Harvard’s Growth Lab. I analyzed the tariffs that Nigerian firms face when trying to export to other African partners. The main idea was to find and identify products where Nigeria might have comparative advantages in productive capabilities and where the other countries are currently imposing high import tariffs that the AfCFTA is going to reduce. Let’s go.
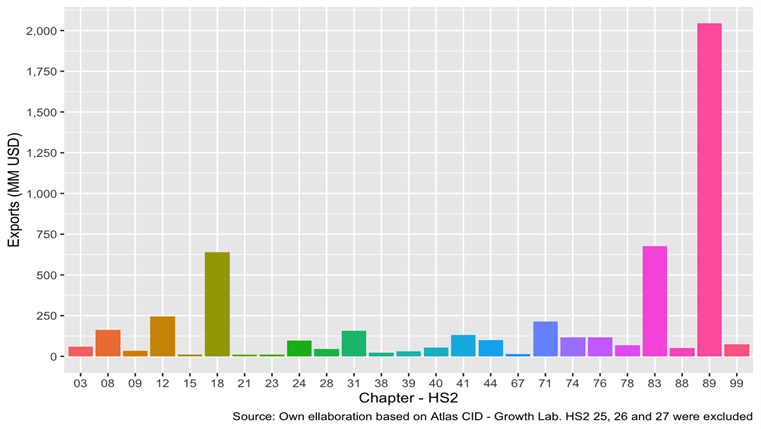
Nigeria mainly exports oil derivates (see Figure 1), and in those chapters (2-digit level of the Harmonized System (HS)) where exports were relatively high in 2019 (see Figure 2), we do not see very promising stories. In chapter 89 — which represents ships, boats, and floating structures — exports are mainly scrap vessels. In chapter 83, the data is just capturing a sporadic and unique export of metal articles that occurred in September 2019 and were not repeated in any other year. In chapter 18, we only find exports of raw or roasted cocoa beans with no further industrial processes.
Figure 1: Nigeria’s exports by sector

Figure 2: Nigeria’s exports in 2019 by Chapter (HS 2)
Therefore, for Nigeria, we need to dig deeper to look beyond the exports that dominate current trade and to those that might be nascent now but represent strategic growth opportunities. To find products with potential export opportunities we need to develop a systematic methodology that could be applied to every HS chapter. To develop such an approach, I take advantage of a detailed dataset that includes every import tariff that Nigeria is paying when trying to export to African countries.
Nigeria is part of ECOWAS, a custom union composed of 15 countries2, so for these countries, Nigeria is already paying 0% of import tariff. However, for the rest of the countries, the average levels are considerably high, as shown in Figure 3.
Figure 3: Tariff faced by Nigeria when exporting, Simple and Weighted (Exports 2019) Average

Considering that Nigerian exporters face high tariffs in some countries, a natural question arises: which products are going to have the highest tariff reduction? Additionally, it is useful to focus on products that have two characteristics: (1) they are being exported somewhere by Nigeria (let’s say, exports were higher than USD 3 MM in 2019), and (2) they faced a high average tariff (let’s say higher than 20%). Figure 4 shows products along these two dimensions.
Figure 4: Nigeria’s Total Exports and Tariffs faced in African Countries (excluding ECOWAS)

If we focus our attention on those products that have these characteristics, we find 10 products where Nigerian exporters would be likely to benefit from the FTA. These represent perhaps the clearest opportunities to increase exports on the intensive margin. Let’s look at some of these products, for example, crustaceans and beers, to understand the opportunity space better.
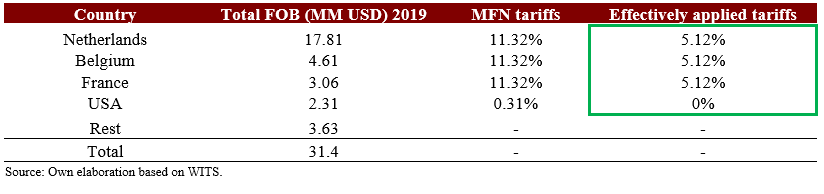
In the first case, a quick analysis in Table 1 shows us that Nigeria is exporting more than 90% of its crustacean exports to European countries, and that the effectively applied tariff in those countries is around 5%, while the average tariff to export to African countries is greater than 20%. Considering that Nigeria is the second-largest producer of farmed fish in the continent, and that many businesses are small and medium firms, it would be relevant to understand what type of characteristics the exporting firms share and how they succeeded in obtaining the required certifications to access into markets with high-quality standards such as the European Union or the US. On the other hand, the current production in Nigeria seems to be lower than its local demand. Therefore, to increase exports to African partners, Nigeria would seem to have to increase the local production3.
Table 1: Total Nigeria’s Exports 2019 of Crustaceans (HS4 0306)
The second case, beer, is quite different. As shown in Table 2, Nigeria exports to countries with 0% of applied tariff but also to Cameroon, which represents more than 20% of exports but where the tariff is 30%. This is in line with the average tariff across all the African countries, 26%. How is Nigeria successfully exporting to Cameroon even when the applied tariff is so high? How many firms are exporting beer to Cameroon? Is the tariff reduction going to incentivize more exports? To answer these questions, it would be indispensable to better understand the business profile and perspectives of the largest companies, like Nigerian Breweries.
Table 2: Total Nigeria’s Exports 2019 of Beer (HS4 2203)
The same analysis for the other 8 headings also gives interesting results. In general, Nigeria is currently exporting these products to countries with low tariffs, so it is possible that the AfCFTA could increase export opportunities in those products (and perhaps in other goods that are not being exported due to high tariffs and we are not detecting in our exercise).
This analysis is my first attempt at combining data from current exports and import tariffs in a systematic way to identify where export opportunities could be. The cutoff could be modified (1 instead of 3 MM, or 15% instead of 20% of import tariff), and one could also study or analyze the imports of the other African countries to better understand Nigeria’s role in those markets and the potential advantage that Nigeria could have with the AfCFTA compared to other exporters.
Since we are just using import tariffs and trade data, we must continue asking questions and exploring other trade aspects, such as non-tariff barriers or rules of origin and procedures or studying specific industries that could get positive and significant gains with the Agreement. Analyses like this are nevertheless important because within the complex spaced of trade and industrial policy in the context of new developments, like AfCFTA, it is often difficult for policymakers and other stakeholders to know where to start looking for opportunities.
A key advantage of this approach is that it can be easily repeated in any other African country, and by using it we can get initial ideas of which industries (in each country) could benefit through AfCFTA in terms of tariff reductions, and therefore inform local strategies in support of local businesses.
1See https://www.brookings.edu/blog/africa-in-focus/2019/02/22/figures-of-the-week-increasing-intra-regional-trade-in-africa/
2Benin, Burkina Faso, Cabo Verde, Cote d’Ivoire, The Gambia, Ghana, Guinea, Guinea-Bissau, Liberia, Mali, Niger, Nigeria, Senegal, Sierra Leone, and Togo.
3See https://www.feedstrategy.com/africa/nigerian-state-attracts-fish-farming-investors/
Enzo Dominguez Prost is currently pursuing a master’s degree at Harvard Kennedy School (MPA/ID, expected graduation in May 2023). Previously, he worked in Argentina for five years in the Ministry of Production on topics related to industrial policy and international trade. He has a BA (2012-2015) and a MA (2016) in Economics from “Universidad de San Andrés” (Argentina).
Using a problem-driven approach in Ethiopia
Guest blog by Abdu Nuru
This is a blog series written by the alumni of the Leading Economic Growth Executive Education Program at the Harvard Kennedy School. 65 Participants successfully completed this 10-week online course in May 2021. These are their learning journey stories.
It was my director in my department who sent the email to us briefing us about the program. It specifically addressed those who were in a more senior leadership level as it would be more important. I read the whole email and I knew it wasn’t meant for me because it said case team leaders and blah blah blah. And I thought who said that? The last thing I could get is rejection and if I am accepted, it would be a great experience. I applied and I was admitted.
That was my journey to the first formal online program, and it ended up being a very important course especially to people who work in a similar sector to me. From defining a regional or national growth problem to devising a high level and inclusive strategy, Leading Economic Growth offered miraculous insights and approaches on how to solve complex problems.
I work at the Ethiopian Agricultural Transformation Agency, Analytics Department as an Analyst. We usually work in a group of 4-6 people to solve complex and challenging problems, address major constraints in the agricultural sector, and propose creative and adaptive solutions. Although we have a structured approach to solving different kinds of cases, we never usually have the chance to be problem-driven as in the LEG way. A problem or challenge is provided to us and some causes for that, and we try to solve these problems. We don’t examine if these factors or constraints caused the given problem.
In LEG, constructing and deconstructing your economic growth challenge gives you full insight into how to approach your challenge. Diagnosing your growth challenge to reach the exact syndromes, constructing a fish-bone diagram to have a visual of your challenge, identifying your binding constraints give you a real-world experience of addressing growth challenges.
The peer learning session and live Q&A session have given me a new perspective on how to look at the economic complexity of the largest country to the smallest state. I have gained a good share of knowledge on measures of economic complexity, import and export factors, and the relationship between know-how and growth.
Although I didn’t attend all, the deep dive sessions have been thorough on the topics raised. It becomes very clear to someone who even learns it for the first time. The individual assignments on our growth challenge were very important as they were the motivations to read the materials and watch the videos provided to us on Canvas. We shared our assignments in the peer learning group, gave constructive feedback to each other, re-iterated and refined our works to the last time. Every group member was very engaged, supportive, and has been throwing challenging questions with everyone.
I live in Ethiopia, and as you have already known, I am in a complex situation for now. When things get smooth and cool, the first thing I want to do is take a course at the HKS on-campus. I hope that will give me a great experience more than the online program. Thank you so much for your continuous support.
To learn more about Leading Economic Growth (LEG) watch the faculty video, and visit the course website. This blog was originally published by the Building State Capability program. Visit their blog for more learning journey stories.
Accelerating Sustainable Growth in Albania through Targeted Investment Promotion
Authors: Daniela Muhaj and Tim O’Brien
“[Targeted investment promotion] requires people in and out of government to imagine
what is not yet there, figure out what is needed to establish it, and determine whether
it would be both feasible and valuable to society.”
– Ricardo Hausmann
Between 2014 and 2018, the Albanian economy experienced accelerating growth and structural transformation, which has been tied to the arrival of foreign companies (Hausmann 2018). Our updated growth diagnostic tracks Albania’s recent growth history and describes key steps needed to seize additional growth opportunities. Albania has the potential to realize much more and more diversified foreign direct investment (FDI), which will be critical to accelerating sustainable growth in the period of global recovery from COVID-19. The Growth Lab team coordinated with the Government of Albania to research, develop tools and build capacity toward this end.
TIP is a coordinated approach to addressing the information
problem in attracting efficiency-seeking FDI that
can thrive without costly incentives.
The Government of Albania (GoA) is pursuing various investment promotion and attraction strategies (see Table 1). The targeted investment promotion (TIP) approach complements existing tools by capitalizing on Albania’s many existing comparative advantages to attract efficiency-seeking FDI. TIP would not displace Albania’s Strategic Investment Law, which provides incentives for certain investments, nor the activities of the Albanian Investment Corporation (AIC), which aim to expand the country’s comparative advantages. Efficiency-seeking FDI — global companies that expand into Albania to serve global markets because it makes them more productive — will not need extensive tax incentives, regulatory exemptions, or other subsidies. In fact, an overreliance on these approaches can — and probably does — crowd out firms that do not want or need to rely on government support (see Figure 1). Leveraging targeted investment promotion within Albania’s growth strategy would lead to more jobs, better quality jobs, faster convergence with the income levels of the rest of Europe, and ultimately less outmigration.
Table 1: Three Distinct Tools for Investment in Albania
| Government Tools | Goal / Type of Investment / Requirements |
| Targeted Investment Promotion (TIP) Network |
To overcome the information scarcity or misinformation problem in attracting efficiency-seeking FDI that can thrive in Albania without costly incentives.
|
| Law on Strategic Investments |
To utilize a private investment incentive package that would deliver very large economic benefits, which may not be commercially viable in Albania without such incentives.
|
| Albanian Investment Corporation (AIC) |
To develop investment projects that are not commercially viable by the private sector because they require the active participation of the public sector in some form.
|
1 Promotion does not stop with first contact or the generation of a “lead.” It must continue in the form of proactive follow-up (or “facilitation”). This facilitation involves both connecting specific companies to specific locations where they can set up operations and helping companies to efficiently solve specific delays and roadblocks that may arise through coordination with various public sector entities.
Figure 1: Key Elements of Targeted Investment Promotion in Albania
| Targeted | Investment | Promotion |
| Identify companies through an objective process to prioritize those that would be both likely to thrive in Albania and deliver significant economic benefits. | Focus on efficiency-seeking FDI – business investments, which can expand in Albania because they can thrive in producing goods and services that they sell not only in Albania but also to the rest of the world. | Engage in proactive and iterative promotion efforts, whereby a coordinated network of Albanian officials’ contacts companies that could thrive in Albania. |
| Make clear and well-developed cases (pitches) as to why and how a foreign company can succeed by investing to expand their business operations in Albania. | Prioritize companies that employ Albanian workers, and seed industries and innovation in the Albanian economy that drives up wages and builds the economy of the future. | Support the process of business entry and start-up of operations without the need for use of tax incentives, free land, regulatory exceptions, or other incentives, as these companies are poised to be profitable without such giveaways. |
Source: Growth Lab elaboration.
To translate the concept of TIP into practice, our Policy Research and Digital Development & Design teams worked closely with the Albanian Investment Development Agency (AIDA) to build several tools to enhance the Government of Albania’s ability to implement TIP, and then convened working meetings to begin to apply them. Our goal was to collaboratively identify several potential starting points where the AIDA Research Unit could begin to develop targeted pitches and informed strategies for outreach. These starting points were generated through an objective process that drew on evidence from our Albania Industry Targeting Dashboard, which can be used together with the Atlas of Economic Complexity. Both are publicly available tools that can be used to help identify global businesses whose investment would be both viable in Albania and attractive to Albania. Our initial analysis indicated that the following industries represented promising starting points for AIDA to organize TIP activities around:
- electrical wiring and devices
- plastics and derivative products
- agriculture exports, food, and seafood processing
- software development, data processing, hosting and related activities.
Investment starting points were identified through an evidence-based
process drawing on insights from our collaboratively
developed open-source tools.
Exploring One Example
Once a broad industry is identified, the process then requires a more in-depth research dive to build a business case and a customized investment pitch. Let’s take a closer look at the case for expanding software development, data processing, hosting and related activities. This is an industry with high viability and very high attractiveness in Albania, and a prospective area of dynamic international investment in the wake of the COVID-19 pandemic. Given the development and growth of Business Processing Outsourcing (BPO) in recent years, Albania already has firms intensively involved in business services in comparison to the rest of Europe. While the growth of the sector has been mainly driven by call centers and customer-service related activities, recently higher skilled opportunities such as accounting and auditing services, data processing and web services have emerged. There are examples of successful companies who have been able to invest and scale in Albania (see mozenda as an example). However, the opportunities for moving beyond the call center model to more complex business outsourcing opportunities are vast but poorly identified to date.
The types of questions that could be asked while conducting additional research to identify specific opportunities in software development, data processing, and related activities include:
- What are the higher end business services that have already emerged in the past few years and how can they be scaled? Are there opportunities to collaborate with leading companies in Albania that would now like to see the ecosystem grow to develop sophisticated pitches to other companies?
- What additional opportunities does the existence of accounting, web services and data processing activities unlock? What are the main regional and global companies in these areas? Who has expanded into the Balkans in recent years? What are their business and expansion goals? Do they match Albania’s comparative advantage?
- What emerging sub-sectors and applications are scaling because of COVID-19? Among these, where might Albania have the greatest viability?
The proposed list of starting investment opportunities and the example outlined above are far from exhaustive. They merely provide some ideas with which to start. The process of identifying opportunities and generating customized pitches should be ongoing and iterative within and across targeted industries.
Investment starting points were identified through an evidence-based process drawing on insights from our collaboratively developed open-source tools.
Coordinating within Government to Coordinate with New Investors
It is also important to recognize that targeted investment promotion in practice is not something that can be done by isolated individuals but rather requires a coordinated network of government actions. Albania already has several parts of a network in place (see Figure 2), including AIDA and numerous ambassadors abroad that have been trained in economic diplomacy. AIDA also utilizes the internal e-Invest platform as a tool for coordinating the network to ensure that investment leads receive appropriate follow-up attention and that progress through the investment process is tracked. This network has allowed for some improvement in Albania’s investment promotion. However, the fruits of investment promotion remain limited because the network’s actions are not targeted. Addressing these bottlenecks and expanding the investment promotion network though efforts like the recent Connect Albania platform, which mobilizes diaspora members in advancing investment attraction efforts, could result in many more promising leads and an effective facilitation process.
An effective TIP practice requires a coordinated network of institutions and stakeholders that can pursue well-identified investment
leads by employing a consistent approach.
Growth Lab research and capacity building in Albania has found that the key step needed to make TIP fully functional in Albania is a strong coordination mechanism at the top. This could be an individual appointed by the Prime Minister with a specific mandate to activate TIP, who would be authorized to develop KPIs for various parts of the network, monitor actions, and direct funding to fill in gaps that emerge. Importantly, TIP would be extremely inexpensive for its expected benefits in stronger growth and job creation. Directed spending on the order of a few hundred thousand dollars per year to expand staffing in different units and improve information tools would be expected to increase the rate of economic growth and income levels across Albania for years to come.
Figure 2: Schematic of the Investment Promotion Network in Albania
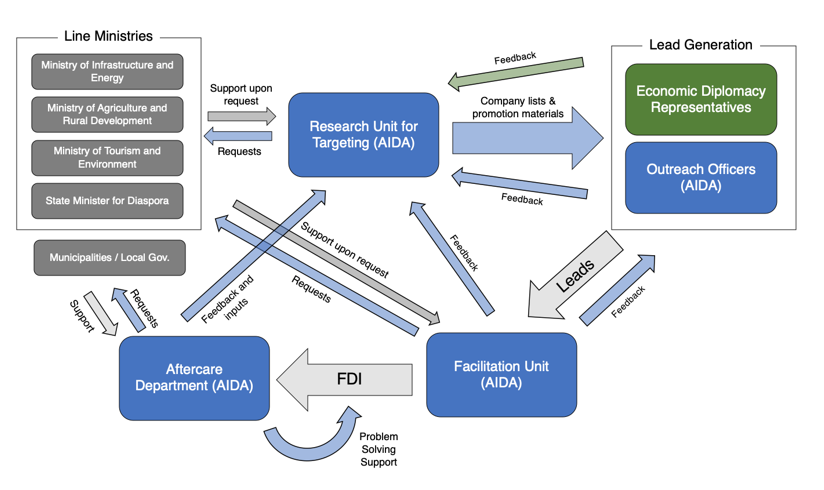
Source: Growth Lab elaboration.
A successful TIP approach, which should be iterative and adoptive over time, has the potential to unlock complementary investment and growth opportunities in Albania and beyond. As developing countries around the world gradually and unevenly emerge from the COVID-19 pandemic, pressures to deploy scarce fiscal resources wisely will continue to amount. With limited room for costly incentives, countries can utilize a targeted approach to investment promotion to attract the type of investments that can rightly serve their development needs. Instead of merely focusing on compensating desirable investors for what a country lacks, governments can and should target investors that can gain efficiency and scale based on country-specific comparative advantages. TIP provides a framework for organizing an effective investment promotion network that can systematically identify and pursue promising growth enhancing opportunities.
A Hamiltonian moment for Europe? Demystifying Next Generation EU and the EU’s recovery funds
The Next Generation EU (NGEU) programme represents a milestone towards fiscal mutuality against common shocks in the EU, changing the way the Union finances itself. This is why the LSE European Institute hosted a panel event aimed at bringing together experts from a wide array of experiences to explore the design and implementation of the NGEU, weighing the positives against the negatives.
In this blog, Renato Giacon and Corrado Macchiarelli give an account of the discussion that took place on March 9, 2022, at LSE.
The Next Generation EU programme is changing the way the EU finances itself as never had the European Commission borrowed at such large scale and long maturities on financial markets. Meanwhile, six EU Member States (Italy, Greece, Romania, Portugal, Slovenia and Cyprus) have decided to make the leap of faith and have included a formal request for concessional loans in their adopted Recovery and Resilience Plans, counting to overcome their large funding needs post Covid-19 but also a decade of low investment expenditure.
The LSE European Institute organised a panel discussion, focussing on how NGEU and the EU Recovery Fund (EU-RRF) should be designed and implemented to (i) better focus on effective, efficient, equitable and sustainable ways of spending EU and national money for bankable projects; (ii) successfully mobilise private sector funding from institutional investors, International Financial Institutions (IFIs) and commercial banks; and (iii) deliver the promised medium to long-term benefits in terms of economic convergence, complexity and higher growth patterns that EU countries can derive from it.
The national Recovery and Resilience Plans (RRPs) – that each EU Member State (MS) is asked to compile and stick to – are embedded in the European Semester, the EU’s framework for economic policy coordination, with grants and loans’ payments to EU MSs released only upon the successful implementation of performance-based milestones. These are defined both in terms of investments and reforms, with the additional request to achieve ambitious green and digital targets. Such an enhanced policy steering at the EU level must balance different national agendas driven by often competing political economy needs. The mechanism represents a strong external market discipline both in the funding and the investment framework, which finds a precedent only in the experience of some EU countries such as Greece under the Enhanced Surveillance Framework post-2010.
The discussion opened with the remarks of Ines Rocha (EBRD) who built her intervention on the operational insights provided by the active role of the European Bank for Reconstruction and Development (EBRD) in the implementation of the NGEU programme and the deployment of the Recovery Funds. She made the point that large RRF grant-funded projects are usually included ex-ante in countries’ RR Plans, while smaller projects that are part of broader investment programmes might be selected through public tenders or similar procedures. Private sector projects to be financed via RRF loans mainly depend on the IFIs, national promotional banks and commercial banks’ pipelines, creating an important private sector-led investment stream in the implementation of the programme.
Furthermore, EU countries – which have requested EBRD engagement in the delivery of their RRPs – have recognised that EBRD is strategically aligned in its own priorities and country strategies with the national Recovery Plans. The EBRD can assist the countries in delivering policy objectives and leverage the EU recovery grants and loans by attracting other private co-financiers to facilitate successful programme delivery.
The most typical sectors of EBRD intervention include the areas of:
- Green growth (such as financing renewable energy, electricity storage projects, hydrogen production, green cities, clean mobility and energy-efficient buildings’ renovation)
- Accelerating the digital transformation (5G, gigabit networks and fibre optic networks, broadband projects, digital upskilling and reskilling programmes, support for the digitalisation of businesses with a particular focus on SMEs, start-ups & greater cloud usage)
- Financing R&D and innovation projects outside the digital sector such as in the field of climate innovation (i.e. fertilisers, cement sectors).
She ended her intervention by pointing out that the most concrete EBRD engagement under the Recovery Funds so far has been in Greece through the Corporate Loan Facility. The programme will combine up to €500 million of RRF concessional loans managed by the EBRD, up to €500 million of EBRD commercial own-resources financing and financing from private investors and commercial banks. The EBRD signed an Operational Agreement with the Greek Ministry of Finance in November 2021. From the point of view of project structuring, the Greek RRF Facility is unique insofar promotes financial discipline by private sector final beneficiaries which have to pay back the loans, encourages proper risk assessment by market players in the absence of Greek state guarantees and leverages RRF funds through co-financing with private sector funding sources.
Some of these points were picked up by Professor Anthony Bartzokas (LSE Hellenic Observatory and the University of Athens), who singled out the NGEU as a new important tool to support investment recovery in the EU, funded through the Commission’s borrowing on the capital markets. Furthermore, he emphasized the early positive signals from markets with NGEU-related announcements already demonstrating a significant spread-compressing effect on euro area sovereign borrowing costs. In addition, Bartzokas recognised in his intervention that the investment stimulus provided by the EU recovery funds includes fine-tuning opportunities in response to concerns about European resilience, especially at a time of elevated geopolitical risk and green transition uncertainties such as the current one.
He continued by identifying a few possible implementation gaps in the EU Recovery Funds linked to the focus on thematic clusters with limited microeconomics considerations, the need for detailed cost justifications during project cycles, and overlaps vs. complementarities with the European Structural and Investment Funds (ESIFs) and EU cohesion policy. Particularly, he highlighted how the experience of ESIFs and other existing EU funding programmes has already driven the evolution of investment decisions of different policy institutions at different governance levels (i.e., European Commission, the EU member states, IFIs and private sector’s financiers) and advocated a similar learning process in the governance processes of the EU-RRF. Finally, he underlined some legacy issues identified from the EU Cohesion Policy experience in the academic literature, including the lack of timely implementation, limited project upstreaming capacity and a funding substitution effect for the national budgetary component, as important priority areas for the monitoring function of the EU-RRF in the implementation phase.
Vedrana Jelusic Kasic (Privredna banka Zagreb) brought a private sector experience to the panel, both in her role in the Management Board of Croatia’s second-largest commercial bank and former regional Director at EBRD with the lead on projects in Croatia, Slovenia, Hungary and Slovakia. She shared her direct experience co-financing with the ESIFs and provided insights on how the new EU-RRF will be different in terms of effectiveness, efficiency and sustainability.
She highlighted how the past experiences with EU funds had not always delivered to the initial expectations due to a combination of various reasons, such as:
- Cumbersome reporting requirements
- Lack of coordination between EU co-funded programmes and the national programmes
- A lack of bankable projects which would have required a need of technical assistance funding for project preparation and implementation support
- A legacy of poor absorption capacity from Managing Authorities which would have required improvements in the quality of government and the enhancement of administrative capacity
- A realisation that the type of expenditures under European Funds had often given priority to basic infrastructure projects, instead of also trying to prioritize the advancement and reconstruction of the productive environment and the support of investments.
However, she also offered a positive way forward in pointing out that the experience with EU funds in the previous EU budget has served as a lesson in the design of the new EU-RRF which have a few in-built advantages that need to be translated from design to implementation. The release of funds is performance-based with a clear set of reforms and investments’ milestones which create clear incentives for EU MSs to deliver on their EU-RRF commitments. Secondly, the funds focus on two clear strategic priorities, the green and digital agenda, which are aligned with the key implementing partners’ agendas and should avoid “spreading the funds too thin” on the ground. Finally, EU-RRF leaves autonomy to the EU MSs to set their own country-specific reform and investment priorities, while letting implementing partners set up their financial structures at the operational and implementation level.
Finally, Dr Frank Neffke (Complexity Science Hub Vienna, Growth Lab Associate) focused on economic complexity and the lessons of economic geography as a cornerstone of economic recovery and growth in the post-Covid-19 EU. He made the point that geography still matters, especially for trade and FDIs flows. He highlighted how “path-breaking growth” would often require the ability of attracting high-skill workers, as well as the ability to generate return migration: low skill workers that move from advanced to less advanced economies (e.g., Albanian return migrants from Greece; Yugoslavian returnees from Germany, etc.). FDIs could help the required investment in skills where foreign firms could help kickstart new tech hubs. In that sense, the mix of policy reforms and higher investment volumes through EU-RRF should be able to increase economic complexity.
He finally pointed out that lessons a sustained and sustainable economic recovery should include priorities such as:
- A transition to a green economy that leverages the capabilities that currently exist and are used already in their economies
- Investments in skills and skill ecosystems
- An exploration of local economies’ “adjacent possibles”
- Aiming for higher complexity
- Focus on connectivity & digitization, return migration and smart inward FDIs
To conclude, there are a number of points worth emphasising about the status and design of Next Generation EU and the EU’s recovery funds. First, this new EU initiative brings together three relevant and interrelated dimensions of consensus-building (fiscal, rule of law, and policy priorities around green and digital). Second, it is innovative insofar as it is strictly tied to an ongoing monitoring and conditionality mechanism of tranches of EU funds being disbursed upon the achievement of clear milestones.
Third, it is timely as it opens the way to other future large scale European Commission borrowing plans, including as part of a response to current EU energy and defence investment needs following Russia’s invasion of Ukraine. Fourth, it highlights the agency and ownership of national authorities in the design and implementation of their national plans but also their reliance on international financial institutions such as the EBRD for co-financing with their own balance sheet, mobilising private financing, managing technical assistance and helping with unlocking policy reforms.
Fifth, it will help EU member states (like Greece) to achieve higher economic complexity, facilitate further integration in European supply chains, invest in skills and ecosystems, and to explore the appropriate green capabilities and attract foreign direct investment.
Sixth, it shows how policymakers in Southern European countries such as Greece, Spain, Italy and Portugal have reflected on lessons learned from the previous euro area sovereign debt crisis, taking reforms and investment milestones seriously and moving ahead of the EU pack in the implementation of their Recovery and Resilience Plans and further disbursements of Recovery and Resilience Facility tranches.
These countries have been the first cohort of EU member states whose plans have been approved by the EU Council. Spain, France, Italy and Greece have all also received the European Commission’s positive preliminary assessments of their second payment requests based on the achievement of several milestones which cover reforms and investments in various areas (energy efficiency, electric mobility, waste management, labour market, taxation, business environment, pensions, healthcare, public transport, and many others).
Finally, and as a counterpoint, special attention ought to be paid to some Central and Eastern European countries where investment needs are high but there are still some delays in the implementation of the plans and the flow of new funds into their economies. Given past problems of scarce absorption capacity and bankable projects, the role of international financial institutions such as the EBRD as well as the European Investment Bank and national promotional banks has become increasingly linked to the success of this new pan-European funding and policy initiative, at a scale unheard of in the history of the EU.
This blog was originally published on LSE EUROPP.
Analyzing Wyoming’s economic growth process and challenges using LEG tools
Guest blog by Marcio Paes-Barreto
This is a blog series written by the alumni of the Leading Economic Growth Executive Education Program at the Harvard Kennedy School. 65 Participants successfully completed this 10-week online course in May 2021. These are their learning journey stories.
When I got my first job in the field of economic development I started reading everything I could about it. I started noticing a stark difference in the rationale and methodologies proposed by the books I was reading. After a while, it was possible for me to separate what I was going to read (even before I got deep in the book) into two categories: strategy/marketing books and development economics/economics books.
In my professional life, I had my fair share of experiences with marketing and the readings of Porter, Kotler, and Chernev. So the second category was the one that disappeared quickly as I learned interesting new things from the thoughts of economists like Acemoglu, Mazzucato, Duflo, and Moretti. And, of course, from the usual suspects like Adam Smith, David Ricardo, and Joseph Schumpeter. I felt ready for my first day of work.
Well, no plan survives contact with reality. The struggle in the regions I was working with were real and the resources that people had available to deal with their challenges did not seem appropriate. Pre-packed solutions from consultants abounded and nobody seemed to be talking about economics when trying to understand the root cause of their problems. Lucky me. I met a Senator from my region with an economics background and working experience with the U.S. Agency for International Development (USAID), World Bank, and the Inter American Development Bank (IDB). There was so much to learn from these experiences.
In order to keep making sense of all this, I reviewed economic development literature looking for best practices. In my research, I found at the IDB website the paper “Smart Development Banks” (Fernández-Arias, Hausmann, Panizza – 2019). This paper put me in touch with innovative minds and novel ways to address perplexing growth issues. By that time I started encountering frameworks and tools that I needed to tackle some of the complex challenges related to economic growth in my region. Then COVID-19 started and I led several “special” projects for a while.
Around the United States, major economic challenges have been met either with investments in infrastructure or with the use of marketing best practices to segment, target and communicate value (assets) of a community. Nothing inherently wrong with that. However, for example, using a SWOT analysis to identify strengths, weaknesses, opportunities, and threats of a business to determine which investments to make or what to market is a relatively simple task when compared to doing the same for a region and its economy.
While in economies with significant growth, the prevalent approach relied on the application of development economics and of economic principles to create specific growth-oriented policies and programs. Are marketing-based solutions so common in the USA due to unique economic development challenges? Do we still believe in elaborate versions of “if you build it, they will come”?
It is easy to assume in the richest nation where opportunity abounds and institutions are strong, that a region is in economic distress because of the market failure referred to as “information asymmetry.” Other times the immediate assumption for failure to grow is of missing infrastructure (buildings, industrial parks, etc.). However, these assumptions are not precise enough and proper identification of market failures is not a simple task. Also, investments in infrastructure can be ineffective and very costly.
The development story of the United States of America is unique in many ways and can provide more insights into this issue. Previous to the transportation and communication revolutions, the economic challenges of the early American republic (1780-1830) were like the challenges developing countries face today, which, in many cases, can be summarized by people and communities producing goods for their own consumption and/or providing raw materials to others to add value.
However, the investments made around the 1800s in transportation and communication created thousands of miles of new railroads, canals, and telegraph lines opening up the productivity of vast regions of the USA to new markets. After this significant infrastructure build up, rural producers could turn what they produced beyond their own consumption into cash. The new material wealth allowed access to things previously out of reach to improve their lives.
Investments were also made in innovative technologies, productivity increased, and more wealth was generated. This quest for productivity led to an explosion in the number of new patents. Entrepreneurs and the state also developed contractual infrastructure where property rights, labor, equity, and debt rules mitigated investment risks.
“Little else is requisite to carry a state to the highest degree of opulence from the lowest barbarism, but peace, easy taxes, and a tolerable administration of justice; all the rest being brought about by the natural course of things.” – Adam Smith
With these foundations in place and the promise of economic opportunity for all, immigrants from all over the world came to the USA in the late 1800s and early 1900s. The influx of new brains (knowhow – tacit knowledge) and the industrial revolution (tools, machines, and patents – codified knowledge) created a great ecosystem. Businesses flourished everywhere, and continued productivity gains created significant wealth in many regions.
So, if this is the American development story, why is it so hard to replicate? Why are businesses not continuing to flourish everywhere in America? Why are some rural economies struggling? And why does the productivity inequality between the metropolitan areas and rural areas continue to increase?
I was trying to piece all this together and learn about what was being done in the USAID, Harvard’s Growth Lab, and MIT’s development economics practices, but I had mixed results and slow progress.
Things really changed when I attended the course Leading Economic Growth (LEG) at Harvard Kennedy School. The course was co-led by Professors Ricardo Hausmann and Matthew Andrews, with a team from Harvard’s Center for International Development (CID), including members of the Growth Lab and Building State Capabilities teams.
This course organized in a comprehensive and easy way what I needed to analyze Wyoming’s growth process and growth challenges. The course also provided me with a framework to engage entrepreneurs, local governments, and stakeholders in effective ways to find solutions to long lingering economic challenges. It also allowed me to better construct and deconstruct a regional growth challenge and identify what the constraints to growth are, instead of relying on pre-packaged solutions or solutions that are best suited for the private sector.
Here are a few of my takeaways from this learning experience:
· Start with a growth-related problem, ask good questions, build a team, develop solutions, iterate, and keep moving. Harvard’s Building State Capability program calls that approach Problem Driven Iterative Adaptive (PDIA). It is like Agile for economic developers. More information here: PDIA Toolkit
· Development is dependent on productive knowhow and growing your economy depends on increasing it. You can gain insights about your existent productive knowhow using what Harvard’s Growth Lab describes as Product Space. Both Atlas of Economic Complexity, Metroverse, and Observatory of Economic Complexity are excellent tools to start understanding your product space and productive knowhow.
· Relevant data and economic models coupled with analytical capability are as important as stakeholder engagement and agility (as in Agile iterations). Integrating the two takeaways described above is crucial to accurately diagnose your growth syndrome and find your growth path.
· Finally, you need discipline and rigor to properly identify your growth syndrome and that starts with a differential diagnosis remarkably similar to the diagnosis used in medicine. And just like in medicine your relationship with your patient (industries and businesses) is critical for a proper assessment.
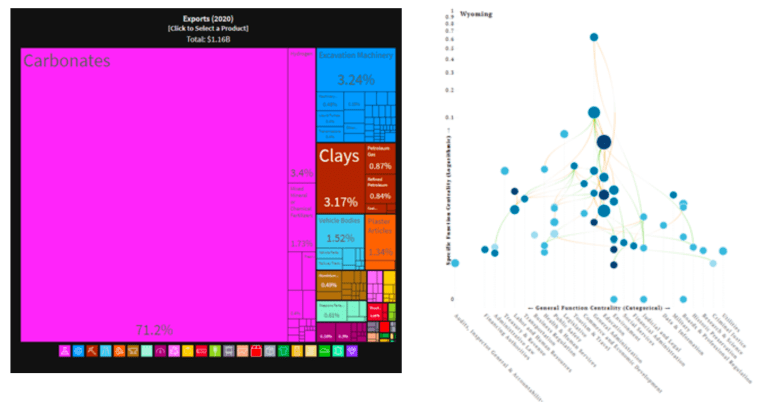
Export basket and State Capacity – What is the correlation between economic complexity and public goods?
Source: Observatory of Economic Complexity and Functional structures of US state governments (Kosack, 2018)
This course also advanced my understanding of economic development by exposing me to growth problems that impacted and still impact other regions of the world. As I mentioned above, the development story in the US is unique. However, learning about international challenges (and solutions) helped me to understand that eliminating binding constraints is the most effective development action that someone can take. As many regions of the world don’t have resources to spare, they need to be very specific about the levers they will use to grow their economies.
HKS’s Leading Economic Growth does not provide you with a silver bullet or answers for all your challenges. Instead, you will have at your hands several frameworks and models to better understand and address your region’s growth constraints.
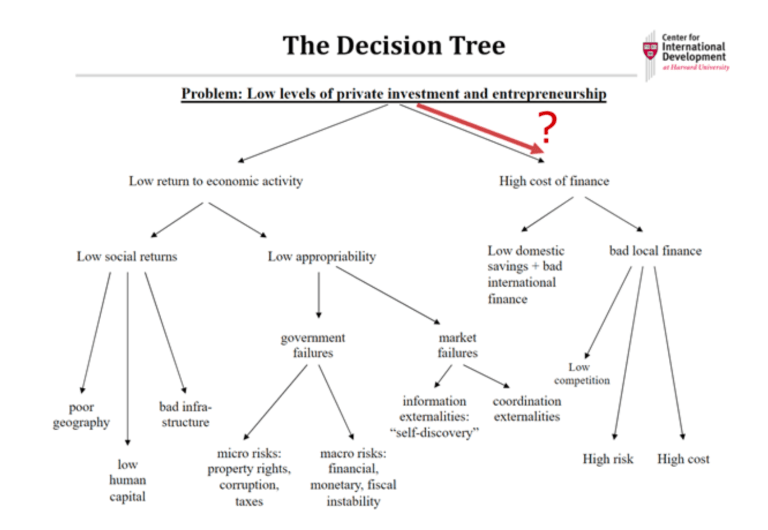
Identifying constraints – Why do you have low levels of private investment and entrepreneurship?
Source: Course Material – Hausmann LEG 2021 – Wk6S1 – Growth Diagnostics in Practice
We know that investments in infrastructure are capital intensive and the current repertoire of tools used by economic developers are not changing the situation in the regions of the USA that need economic growth the most. So, maybe we should look beyond our borders, and learn how Singapore increased its GDP 10-fold since the 1990’s? Or examine how to do economic development when you don’t have funds to create incentives? And what can we learn from the interesting fact that, Germany and Canada have fewer regional disparities than the United States, but the United Kingdom has the same disparities as the US?
I was impressed with the amount of applicable knowledge and on-the-job training that the LEG course provided. As a former experiential educator, I can say that is no small feat. In a true Harvard spirit, the course discussions and assignments provided me more than the course content.
“The great difficulty of education is to get experience out of ideas.” George Santayana
The beginning of constructing and then deconstructing some of our problems
Source: Course Weekly Assignment – LEG 2021
Lucky me round two. During all this journey including the “special” projects time, I had the chance to test some of these ideas with local legislators, elected officials and agency leads. One specific Representative from my region started asking really good questions and we worked together to see how we could apply some of this to our state and in the United States.
I still have lots of questions on my mind, and, as I review my course resources and notes, I feel well equipped to move forward. However, it would be great to continue to engage with Harvard’s CID and other proponents of this approach to discuss how to improve our national economic development practices.
From economic composition to industry space, and to growth opportunities – New ways of generating a SWOT for a CEDS
Source: Metroverse – LEG 2021 exercise with Denver Metropolitan area
Here are a few ideas I would like to explore: How to improve the creation of the Comprehensive Economic Development Strategy (CEDS) required by the Economic Development Administration (EDA)? How to turn Targeted Industry Studies (a new trend around the US) into a more precise tool to attract foreign (and in some cases domestic) direct investments? How to involve other practitioners in this conversation and bring analytical innovation to economic development around the USA?
Are you up to the task? Let me know!
Thanks to the diverse and fantastic participants of the LEG 2021. It was possible to learn from experiences in economic development from South Africa, Venezuela, Mongolia, Mexico, United Kingdom, Afghanistan, Brazil, and both Wyoming and Oregon, USA.
Many thanks to the Harvard Kennedy School, Growth Lab, and Building State Capability teams for putting together such an amazing learning experience. Special thanks to Eric Protzer for all the awesome things he brings to this space.
To learn more about Leading Economic Growth (LEG) watch the faculty video, and visit the course website. This blog was originally published by the Building State Capability program. Visit their blog for more learning journey stories.
Economic growth strategies in North Macedonia
Guest blog by Jones Anthony
This is a blog series written by the alumni of the Leading Economic Growth Executive Education Program at the Harvard Kennedy School. 65 Participants successfully completed this 10-week online course in May 2021. These are their learning journey stories.
– Growth challenge: Slower economic growth compared to neighboring countries
– Country/region/municipality: North Macedonia (NM)
- What are some key ideas/learnings that you will take away from this course?
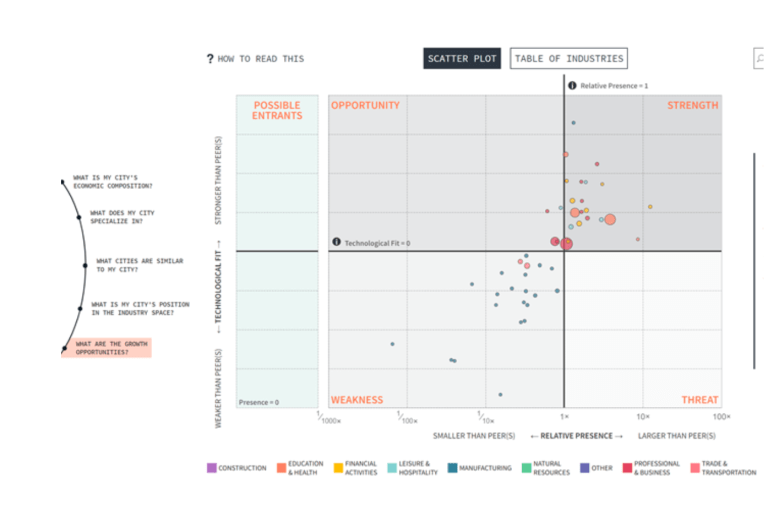
I gained a deep understanding of several key economic growth and public policy ideas from the course. The Product Space analysis is a game-changer for my work on all future targeted industry strategies. Instead of focusing primarily on the industry concentrations and their growth rates (Location Quotients) for a country/region/city, I am now equipped to target those more complex industry sectors that will have the biggest impact on advancing economic growth and increasing the knowhow of the economy. I am also eagerly awaiting the City/Region Complexity Index in May, which I believe will be transformational for local economic development practitioners across the globe.
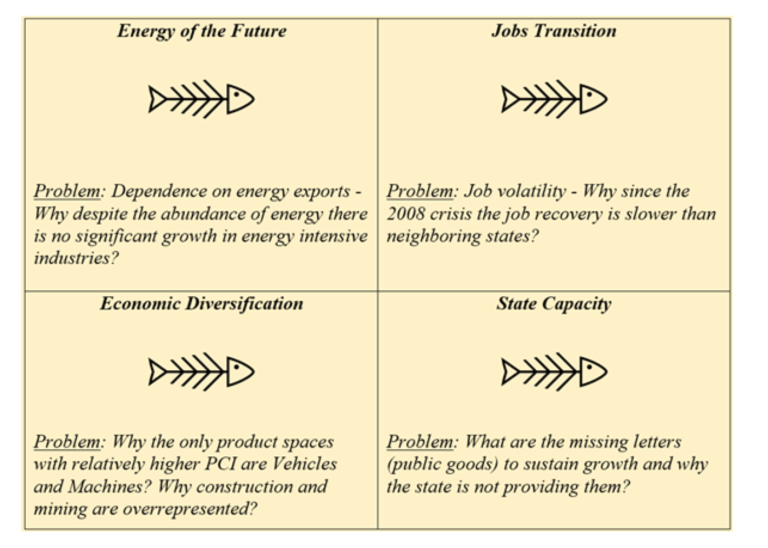
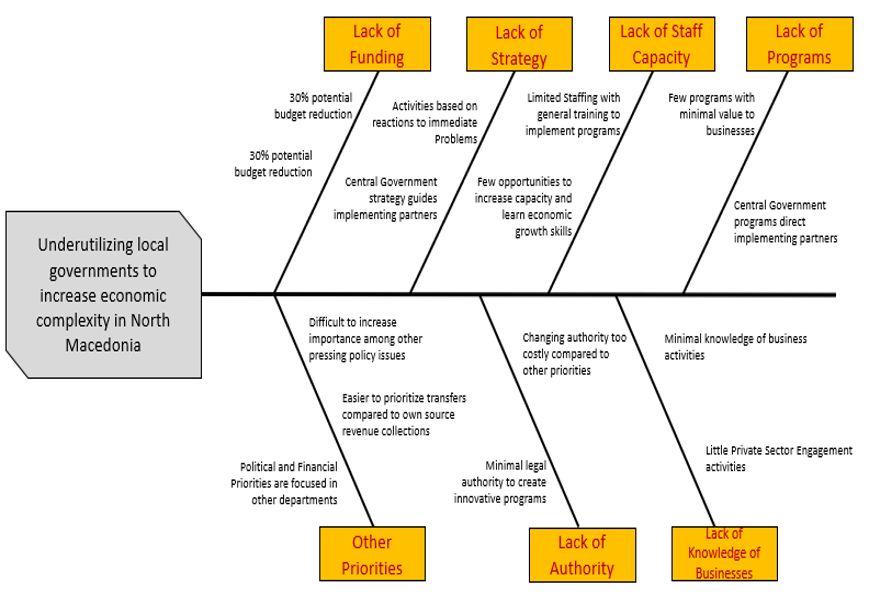
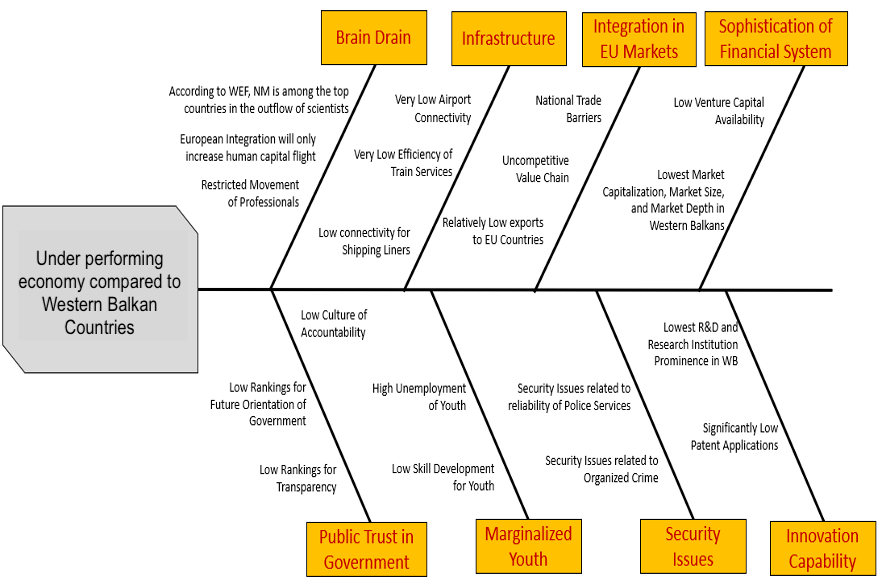
The PDIA toolkit has articulated public policy dynamics that I have experienced throughout my career, but lacked a thorough understanding to navigate. The Change Space, Policy Design Space, and Authorizing Environments have been extremely enlightening for me and will help me guide the policy development process for all future economic growth projects. Focusing on problems instead of presenting existing solutions (Asymmetric Mimicry) has shifted my approach for future consulting proposals and I look forward to the opportunity to craft a Fishbone diagram with a group of key stakeholders during my next project. In addition, utilizing the Searchframe approach, compared to the Logframe approach, is a target that I hope to utilize for upcoming project opportunities with various donor agencies.
The Growth Diagnostic process was fascinating, but I have to continue to read the research provided to more effectively facilitate answering the question tree and properly identifying the most binding constraint to growth for my target community. I believe I understand the principles and theory behind the growth diagnostic framework, but I need to work more on implementation and data analysis to effectively put this theory into practice.
- What progress did you make or what insights did you have about your growth challenge throughout the 10-week time period?
I made strong progress on my growth challenge throughout the course. The more research I did, the more I modified my Fishbone Diagram. Having a project that is not within my existing country nor within an existing employment position made it more difficult to engage with stakeholders to get a better understanding of the problem. But I utilized as many data sources as possible to expand my understanding and frequently completed desktop research on existing donor programs and research to inform my problem definition. This was a very fruitful exercise because it would be the same activity I would complete if put on assignment for an economic growth project in NM.
The ‘sense of us’ discussion was challenging because NM continues to struggle in this area. Their efforts to become integrated into the European Union have been negatively impacted on two separate occasions by two separate countries. Their ‘sense of us’ is being challenged in regard to their name and language, which are core components to a country’s identity. This challenge is going to be difficult to overcome, but the research provided from the course is going to be helpful in understanding opportunities for advancement.
- How are you using or will you use what you have learned in this course?
As previously referenced, I have already incorporated the PDIA approach into proposals for economic growth strategies throughout the state of Ohio and for USAID projects in North Macedonia and Sri Lanka. Leveraging the PDIA policy development process with the economic complexity framework has been instrumental for me in making innovative proposals that incorporate these approaches when implementing economic growth strategies.
I plan to continue researching and analyzing the literature provided by the course to continue growing in my understanding of the material and concepts. I’m hopeful to also proselytize the value of City/Region Complexity Index for communities throughout the USA through my membership with the International Economic Development Council and the Ohio Economic Development Association.
- What open questions do you have that you wish the next course could answer?
I found the program to be very generous in regard to providing available research material on a wide variety of topics. I sincerely appreciate that fact because my professional experience has shown me that obtaining academic research can be cost-prohibitive when doing public policy development work.
I would like to better understand the econometric theory used to create the Product Space. This would allow me to better understand the connections between products, which would be helpful to gain buy-in from economic development policymakers. I also think it would be helpful to provide additional examples of what data sets and data gathering activities can be utilized to complete the decision tree for a Growth Diagnostic.
- Feel free to add photos of your fishbone diagrams, assignments, meetings, or whatever you think is relevant (video/audio).
After thoughtful discussions with my classmates and teaching assistants, I realized that I was trying to facilitate a pre-existing solution when I made my initial problem definition. My first and last fishbone diagrams are below that show the change from Week 3 to Week 9 of the program. I feel I progressed in my thinking on how to promote economic growth in NM and look forward to the opportunity for implementation!
To learn more about Leading Economic Growth (LEG) watch the faculty video, and visit the course website. This blog was originally published by the Building State Capability program. Visit their blog for more learning journey stories.
Namibia’s Diversification Strategy: Finding A Way Forward
Namibia is a country of 2.5 million people that gained independence from South Africa in 1990 and shares a legacy of apartheid that informs the socio-spatial distribution of its citizens. Its economy is highly reliant on the exports of a few primary commodities, such as minerals like diamonds, copper, uranium, gold, and zinc, and agricultural goods like fish and livestock. The mineral economy drives much of the growth of the country. Similar to my country, Peru, Namibia had a period of high growth during the commodity boom (2002 – 2015) but is now facing a growth challenge because of exogenous shocks such as falling commodity prices and COVID-19.
The Growth Lab is supporting the Government of Namibia (GoN) in the quest of finding new growth drivers that promote inclusive development. The project covers a wide range of research activities, such as: understanding the drivers of macroeconomic sustainability, diagnosing the constraints to growth and identifying the most binding structural barriers preventing Namibia from realizing sustainable growth and diversification opportunities, studying inequality and labor market dynamics across the country, and analyzing the economic and export diversification opportunities by applying the framework of complexity analysis. A key objective is leveraging the existing capital-intensive industries (i.e., minerals) to set the basis for productive diversification towards industries that can employ more people with higher capabilities and jumpstart the Namibian economy.
Although productive diversification and inclusion are shared goals, there are different approaches being considered to foster these new opportunities. On the one hand, the GoN has consistently promoted “beneficiation” since 2012 through its homegrown agenda. The beneficiation, or value-added, strategy focuses on adding more value downstream to current exports. On the other hand, the Growth Lab sees productive transformation as focusing on sectors that are “similar” in terms of skills and capabilities because of the shared knowhow required in the production process. These opportunities are (i) implicitly revealed through production and export data – i.e., like the product space; and (ii) not necessarily along the lines of vertical value chains, which might seem unintuitive at first glance. Put simply, while many governments believe that a strategy to diversify should go from cotton to textiles, the Growth Lab finds evidence of an optimal strategy that may go from cotton to fruits or coffee. “Similarity” is better understood through knowhow in the production process rather than vertical value chain integration.
Nonetheless, the idea behind beneficiation is intuitive and appealing to an economic-political messaging about “doing more at home.”It is an appealing idea for many reasons: saving on transportation costs as well as secured and cheaper local supply, and domestic import substitution. It also supports a sense of national pride by promoting the notion that employment and skills “evolve” downstream to higher-value products. Moreover, in a country with a dependence on commodities, adding value is also seen as an option to reduce exposure to the volatility of the international markets (i.e., selling batteries is less volatile than selling copper).
However, the Growth Lab has empirical evidence proving that countries do not transform by adding more value to their existing exports down the value chain. Klinger et al (2008) assess the effectiveness of beneficiation by analyzing international trade data for 200 countries over the previous 50 years. The conclusions – which are aligned with the economic literature on the same topic – is that countries do not transform by adding more value to their existing exports down the value chain. Instead, countries accumulate productive capabilities, redeploy, and recombine them into larger sets of more sophisticated products and services. Hence, beneficiation is likely to be unsuccessful.
My role in the Namibia project during the internship largely consisted in creating a new dataset using Namibia’s trade data to identify and compare the two approaches to industrial diversification. Based on Klinger et al (2008), I worked on the analysis, refined it with members of the team and external experts, and then presented my work to the counterparts. My findings were used in the policy recommendations made by the Growth Lab team to the Government of Namibia.
These are just a few highlights of what I learned:
- Analysis is a stronger piece of evidence than intuitive arguments: During my internship, I helped advance the agenda by identifying the top 50 industries that should be prioritized following a beneficiation strategy, and preparing a graph that contrasted them vis-à-vis the industries identified in the economic complexity report within the same product space. The graph showed how beneficiation is “as good as random”: the prioritized industries require different sets of capabilities and can differ greatly from Namibia’s existing industries. The visual contrast between both strategies made a stronger point than any theoretical discussion.
- History matters, context matters, and public perception matters: In the MPA/ID program, we learn that policies are not just about what is technically correct. One must take into account political and administrative feasibility. Given the historically salient role of beneficiation in the country, and in the broader South African Development Community, it was politically complex to expect a full shift out from beneficiation, so the team proposed a “middle ground” strategy: following capabilities first, then beneficiating if that’s in the optimal set. Some products in the plastics and rubbers product group fit these criteria since they were both directly downstream and in line with the existing set of capabilities.
- It matters not only when assessing policy recommendations, but also when thinking about the messages we want to convey: In Namibia, the Growth Lab recognized that we were outsiders to the country and that our message could be perceived as though we believed that the country was not capable of adding value to its existing industries. Thus, we looked for examples of industries where Namibia currently adds value to imported products (i.e., copper) to make the point that we do believe they are able to add value, but that it did not necessarily have to be to domestic products.
- Every good idea on paper leads to a lot of effort to implement them in order for them to materialize: Many policy recommendations sound reasonable on paper but fail to delve into how policymakers can actually “make it happen” given the existing organizational capacity and institutional setup. To address this natural gap in going from ideas to action, the Growth Lab facilitated the introduction of productivity taskforces and developed a framework of best practices to show how policymaking could be implemented to reduce coordination failures that constrain diversification efforts. As part of this process, we met with counterparts in the GoN to first understand similar efforts in the past to set up such taskforces and we incorporated those learnings into our recommendations.
- You cannot pursue single policies in isolation of other policy priorities. They have to complement each other. Fiscal sustainability and industrial policy had to go hand-in-hand: While diversification is a way of addressing Namibia’s growth and inclusion challenges, the team was also very aware of the fiscal constraints that the GoN currently faces. To that end, we argued that a beneficiation strategy was likely to require more fiscal resources given the big push needed to develop new capabilities. Similarly, a key best practice for the implementation of productivity taskforces is that they should not focus on measures that increase profits for firms (i.e., tax benefits), but on measures that help increase overall productivity.
The Limits of the Rule of Law to Address Systemic Corruption
José Ignacio Hernández for the Corruption, Justice, and Literacy Program website
Venezuela is considered one of the world’s most corrupt countries. A common strategy to address its corruption, and one advocated by the likes of the Council on Foreign Relations no less, is “reinstating the rule of law.” Similarly, the International Commission of Jurists has proposed to “recover the country’s democratic institutions and the functioning of the rule of law.”
Without a doubt, the rule of law should be restored in Venezuela to tackle corruption. The real question to ask, however, is this: What is the root cause of corruption in the country? If the cause is flawed rules, then, yes, the solution should be institutional reform that creates new rules and institutions. This in fact is the path Maduro’s regime has followed, while also recommending a legislative overhaul to boost anti-corruption policies.
Plenty of evidence exists, however, to conclude that flawed rules are not the primary driver of systemic corruption.
And, furthermore, the problem with any strategy focused on institutional reform to reinstate the rule of law to promote anti-corruption policy lies in the assumption that the branches of the Venezuelan Government possess the capability to enforce the policy.
Instead, the root cause of the country’s corruption problem resides not in its laws but in the fragility of the Venezuelan state. The first condition to reinstate the rule of law is that the state should have the capability to enforce the rule of law. And that condition is missing in Venezuela.
That is why, according to Matt Andrews, in the absence of a capable state, institutional reforms will have minimal impact; state fragility will prevent effective enforcement of the new institutions. In Venezuela, even the best comptroller under the proper framework would all but certainly fail to implement successful anti-corruption policies.
Rather than push for institutional reform to reinstate the rule of law in Venezuela, we should diagnose and measure the fragility of the state. As in Lampedusa’s novel The Leopard, any anti-corruption strategy based only on an institutional reform will “change everything” to allow everything to stay “as it is.”
Nine lessons from LEG 2020: Economic Diversification of Gabon
Guest blog by Milaine Rossanaly
This is a blog series written by the alumni of the Leading Economic Growth Executive Education Program at the Harvard Kennedy School. 65 Participants successfully completed this 10-week online course in May 2021. These are their learning journey stories.
This course has benefited me tremendously. My background is in business administration so I intuitively understood concepts of growth, productivity, inclusion, binding constraints and others, but this course allowed me to understand them much better. I have a long list of take-aways from this course that I will apply in the future, but perhaps a few highlights are the following:
- It is critical to thoroughly diagnose the problem, identify true binding constraints (and not constraints in general) through a systematic analysis and determine entry points. I really like the use of a fishbone diagram to display these causes in a ‘deconstruction’ of the problem.
- I enjoyed learning about “high bandwidth organizations”, particularly the case of Costa Rica.
- I learnt about the action-learning oriented iterative approach to pursuing a growth strategy, particularly the example of Sri Lanka, which allows an incremental step-by-step approach aiming to invest in building blocks to build legitimacy and political buy-in as we move forward, while drawing lessons at every stage and showing results.
- I understood new concepts like latent practices, positive deviance, gap analysis, complex vs complicated problems and the Problem-Driven Iterative Adaptation (PDIA)
- I learnt so much from the Korea and Singapore success stories, about the importance and role of leadership and multi-agent leadership structures.
- The role of technology in development and the role of knowhow as the slowest form of technology to transfer between individuals, firms, and societies as the limiting factor on economic growth.
- I learnt new sources of data such as the wonderful Atlas of economic indicators.
- I learnt new ways to measure success in growth strategies, the importance of inclusion+growth indicators in the post-Covid ear that focus on reorganizing the economy to promote productive relationships, good jobs and more.
- A few quotes that I particularly liked: “Society knows more, not because individuals know more, but because individuals know different”, “Copying best practice helps you play, but it does not help you compete. Creating gives you the competitive edge.”
I better understood my growth challenge throughout the course of 10 weeks. I deconstructed the problem piece by piece, looked for alternative solutions, identified new actors and agents to involve in the solution, found new data to support the challenge and measure what success would look like and think about an inclusive growth strategy in the post-covid era that focuses on the development of the local economy and strengthening of business services to create employment and generate positive spillovers for the population.
My economic growth challenge was centered on economic diversification in Gabon during this course, but I was recently informed of an upcoming lateral move on July 1 when I will start working on Ethiopia. I will revisit this course and the materials to analyze the growth story of Ethiopia to prepare for my transition. I am really looking forward to it. Thank you.
The course was excellent, professors were incredible, the material was great and very helpful. I wish it was longer!
To learn more about Leading Economic Growth (LEG) watch the faculty video, and visit the course website. This blog was originally published by the Building State Capability program. Visit their blog for more learning journey stories.