How Cheyenne’s Housing Reforms are Easing Wyoming’s Housing Crisis
By Eric Protzer
Cheyenne is the capital of Wyoming, with a population of approximately 65,000. The state of Wyoming as a whole has faced a durable shortage of housing, and like any supply shortage, this has led to inflated prices. Yet in recent years, Cheyenne has enacted several important housing reforms that allow the market to more flexibly create the supply that people demand. This has led to a surge in housing permits and construction, which is set to ease the underlying market pressures behind housing unaffordability.
Figure 1 exhibits a map of housing supply elasticity in the US, with Wyoming highlighted. Elasticity is a key metric that economists use to determine how responsive supply is to demand. In this case, it measures the ratio of supply to price growth during periods of sustained local price growth. In dark areas of the map (including Wyoming), elasticity is low, and thus, housing supply doesn’t increase very much at all when prices increase. In brighter areas of the map, conversely, supply increases more substantially when prices rise. This is crucial because increased supply helps to mitigate price pressures.
Figure 1. Map of US Housing Elasticity, with Wyoming Highlighted
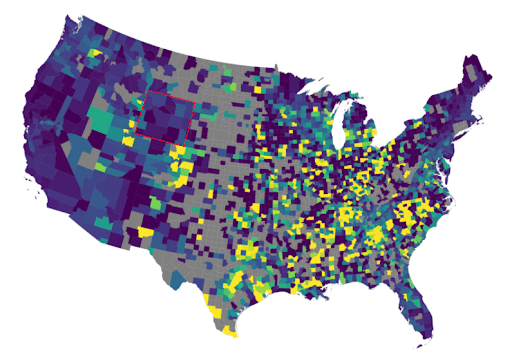
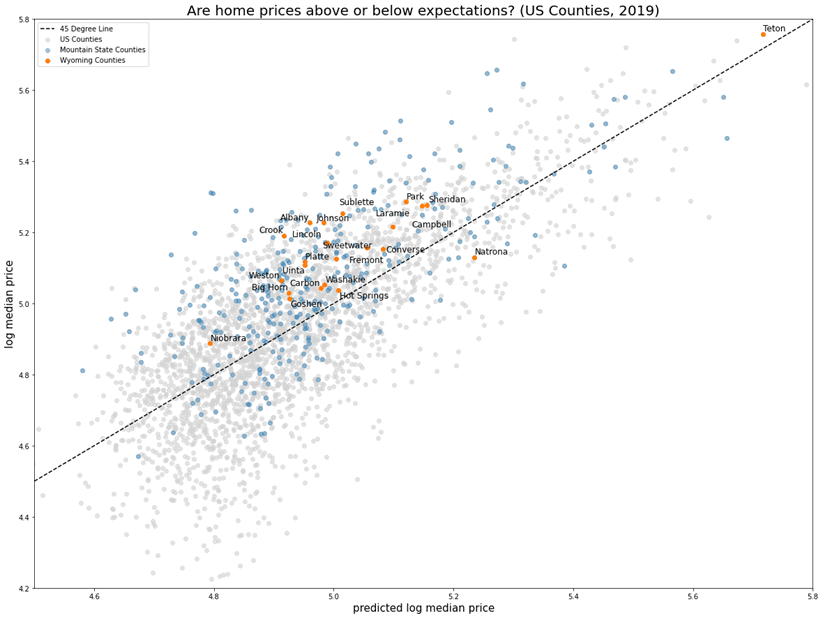
Figure 2 shows that Wyoming’s home prices in 2019 were generally above expectations given economic fundamentals such as population, income, and remoteness. This is an unsurprising conclusion: supply shortages lead to high prices.
Figure 2. Actual vs. Statistically-Expected Home Prices by US County
Many economists would argue that the leading cause of housing supply shortages across important parts of the US is the presence of high regulatory barriers to housing development. The costs of financing, labor, and materials are not terribly different between California and Texas, for example, but Texas builds a lot more housing (see Figure 1) because of a much more free-market regulatory environment.
More specifically, American towns with housing shortages often have strict zoning codes that make it very difficult to develop dense housing, such as starter homes with small yards that are suitable for young families, or apartment buildings suitable for young adults, at prices the average person can afford. Such restrictions can include maximum building heights, minimum lot sizes, minimum setbacks, minimum parking space requirements, zoning that disallows multi-family housing, and more. Lengthy approval processes, which can require multiple public hearings and town council votes, further compound costs by creating delays and uncertainty.
Examples of economic research linking housing regulatory restrictions to unaffordability include:
- Zabel and Dalton (2011) find that minimum lot sizes in Massachusetts increase housing prices by 20% – 40%.
- Hilber and Vermeulen (2016) find that the South East of England would have had 25% lower housing prices if it had followed the lower regulatory burden of the North East.
- Molloy et al. (2022) find that a one standard deviation increase in regulatory supply constraints leads to 10% faster house price growth.
Intuitively, these regulations are influential because they force renters and homebuyers to pay for things they don’t want. In turn, this dramatically reduces supply and increases the price of housing. For example, some US towns impose large minimum lot sizes. These require large yards for all homes, which can look nice, but are expensive due to the cost of land. Young families often prefer more affordable homes with significantly smaller yards, yet regulations prevent the market from building the type of housing supply that is in fact demanded.
The alternative approach is to let the market decide these issues by not regulating them. For example, France has not had any minimum lot sizes nationwide since 2013.
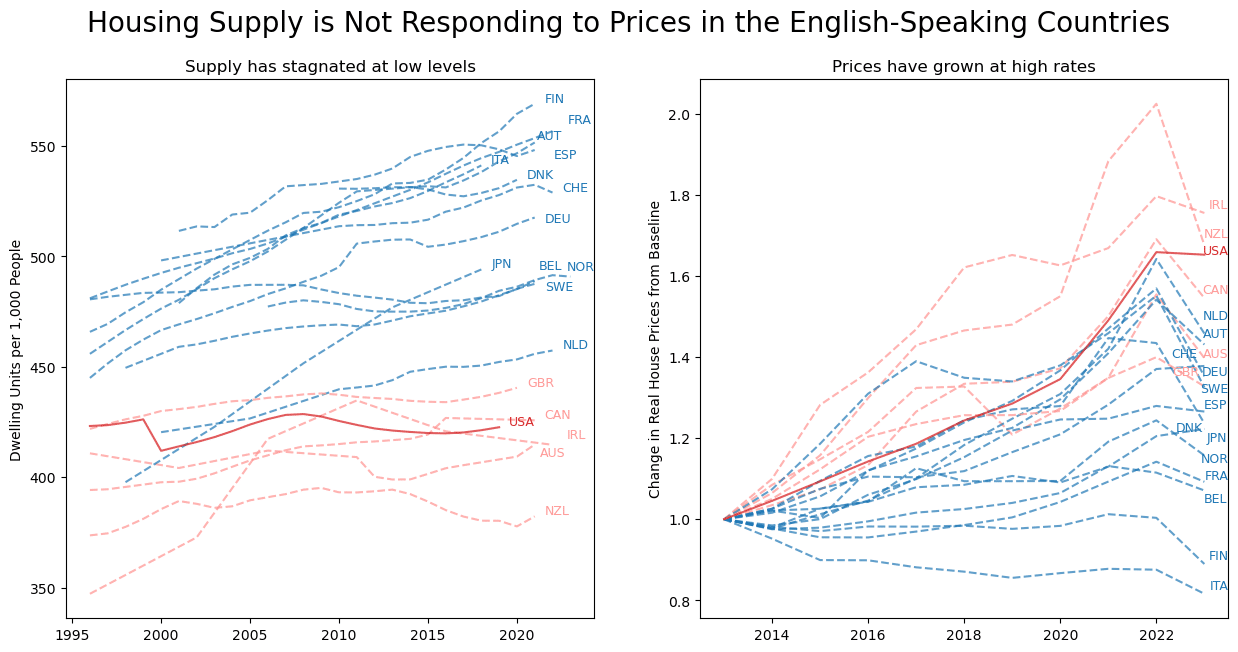
The regulatory problem can, in fact, be so severe that it is evident at the national level. Figure 3 shows that English-speaking countries have stagnated at low levels of housing supply per capita, while the growth of their housing prices has far exceeded that of other high-income countries. Again, the costs of major inputs such as financing, labor, and materials are not enormously different across high-income countries. But English-speaking countries have much higher regulatory barriers to dense housing development, which stem from their common-law legal institutions.
Figure 3. Housing Supply and Prices among High-Income Countries
In light of these dynamics, it is highly notable that Cheyenne has significantly reduced regulatory barriers to new housing supply. Key reforms since 2020 include:
- The creation of “urban loft” uses in commercially-zoned areas of town, which allow the development of apartments.
- Allowed multi-family residential and mixed-use buildings in the primary commercial zone district (Community Business).
- The maximum lot coverage ratio was increased to 80% for several uses, including standard and large lot size multi-family buildings. This allows a larger share of the land area to be used for the building footprint and parking, as opposed to being left as empty space or landscaping. In turn, this effectively reduces the amount of extra unused land and increased perimeter infrastructure (streets, sidewalks, utilities, etc.) that each renter must pay for, which considerably improves affordability.
- Removed required lot area per multi-family unit, which was previously 1,600 sq ft per unit or 1,000 sq ft per unit if above three stories. This similarly reduces the amount of unused land that each renter must pay for, which dramatically improves affordability. For example, a five-story, 50-unit apartment with a building footprint of roughly 10,000 square feet would previously have had to pay for nearly an extra acre of unused land, which in central parts of town can become very expensive.
- Removed all residential minimum lot sizes. This also helps save on the costs of unused land, which is crucial for both multi-family developments and starter homes with small yards.
- Created an urban use overlay that allows for building heights up to 65 feet, lot coverage ratios from 90% – 100%, no minimum setbacks (except on one particular street), and removed minimum parking requirements. This enables especially dense development west of Cheyenne’s downtown, which allows people to live within walking distance to work and provides enhanced foot traffic for local businesses.
- Reduced minimum parking space requirements from 1.5 spaces to 1 space for studio and one-unit multi-family dwelling units.
- Removed luxury material requirements for multifamily building facades and display window requirements for multi-family dwellings.
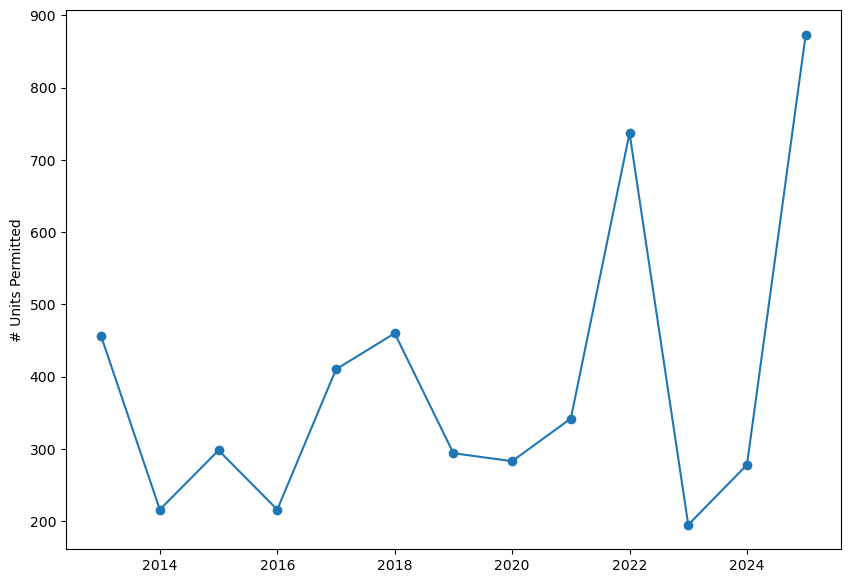
Since this reform effort kicked off circa 2020, Cheyenne has enjoyed bumper years of enhanced housing supply growth (Figure 4). The number of units permitted in 2025 is approximately 2.6 times the annual average from 2013-2019.
Figure 4. Number of Housing Units Permitted Annually in Cheyenne
As matters stand, Cheyenne is especially competitive with nearby towns on lot area requirements (Table 1). Further reform could be enacted in some instances, for example, to further reduce certain multi-family parking space requirements.
Table 1. Housing Regulations in Cheyenne vs. Nearby Towns
| Cheyenne, WY | Laramie, WY | Casper, WY | Fort Collins, CO | |
| Range of minimum lot sizes for residential zones1 | None | 2,000 to 8,000 sq ft | 4,000 to 9,000 sq ft | 0 to 2.29 acres |
| Largest required lot area per multi-family unit | None | 1,250 sq ft per unit | 2,420 sq ft per unit | 3,630 sq ft per unit |
| Largest minimum setback | 50 ft | 60 ft | 18 ft | 80 ft |
| Smallest maximum multi-family building height | 3-4 stories2 | 40 ft | 40 ft | 28 ft |
| Largest minimum parking space requirement per multi-family unit | 1.5 spaces per unit | 1.5 spaces per unit | 1 space per unit | None |
On the whole, Cheyenne has made impressive efforts to reduce regulatory barriers to housing and is seeing a surge of housing supply as a result. Other small towns around America should learn from this example and reduce their regulatory barriers to dense housing accordingly.
1 Excluding zones for agriculture or manufactured homes
2 Some usages allow garden-level units, which may not count as a story depending on interpretation
The Myth of the Wyoming Migration Boomerang
By Eric Protzer
There is a popular concept in Wyoming known as the “boomerang” effect, which posits that people leave the state at high rates but often return later in life. This phenomenon is purported to support the long-term economic vitality of the state, as young people acquire experience elsewhere then move back to Wyoming with the skills they have acquired.
In reality, the Wyoming boomerang is a myth. Some individuals may move back to the state as they get older, but not in sufficient amounts to have a meaningful economic impact. Figure 1 shows the share of people born in each US state who are living in another state (as opposed to remaining in their home state) by age, with Wyoming highlighted in blue. If there was a strong boomerang effect, one would expect that the share of people living outside Wyoming would come down after a certain age. If anything, the opposite is true: older Wyoming-born people live outside the state at increasingly high rates.
Figure 1. Share Born in Each US State Living in Another US State by Age, 2022
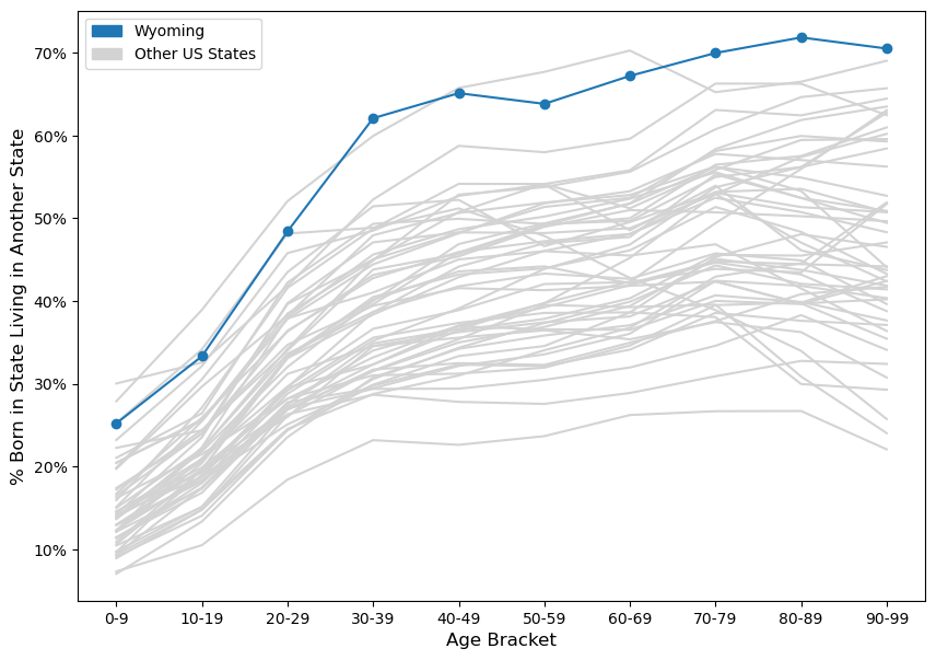
Source: 2022 5-Year American Community Survey
Another way of looking at the data is to follow different individual birth cohorts as they age, rather than a snapshot of all people in one year. Figure 2 follows people born in Wyoming in the 50s through 80s in the 1960, 1970, 1980, 1990, 2000, 2010, and 2019 US Censes as they age[1]. These birth cohorts are selected to ensure we observe people who have at least reached their 30s, so as to provide some meaningful time window for return migration in mature adulthood. Nevertheless, there is no significant boomerang effect in any of the four observed birth cohorts. All left at high rates in their youth, and did not return to Wyoming in substantial numbers thereafter.
Figure 2. Share Born in Wyoming Living in Another State by Birth Cohort over Time
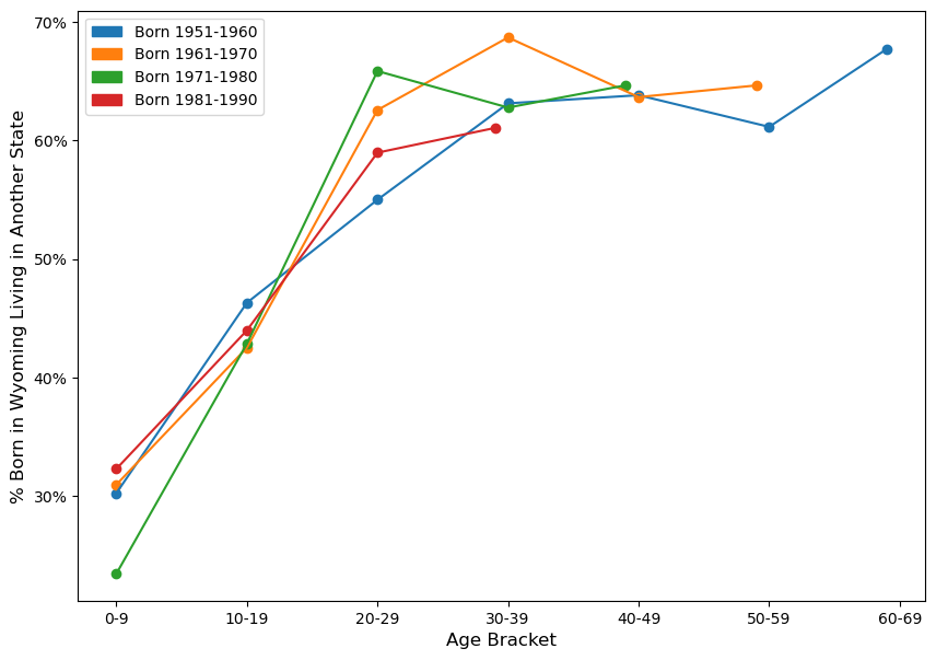
Sources: US Censes and American Community Surveys, Years 1960, 1970, 1980, 1990, 2000, 2010, and 2019
On the whole, it is thus not accurate to say that there is any kind of substantial boomerang effect. People born in Wyoming instead leave the states at high rates into young adulthood, and on average do not return thereafter.
One consequence of Wyoming’s enormous exodus of young adults who do not return is that the majority of the state’s population was born elsewhere. Figure 3 shows a treemap of the birth locations of people living in Wyoming. Those born in Wyoming account for just 42.6% of the Wyoming population. The next two top contributors to Wyoming’s population are Colorado and California.
Figure 3. Treemap of Birth Locations of the Population of Wyoming

Source: 2022 5-Year American Community Survey
[1] We avoid the 2020 census because of the effects of the COVID-19 pandemic, which could both induce irregular temporary migration patterns and statistical problems with the census sampling procedure itself. We instead use the 2019 census given that it is only one year beforehand.
Mixed Methods Valuable in Tackling Key Challenges in Wyoming
By Tim Freeman

Since August 2022, the Growth Lab has collaborated with the state of Wyoming to understand pathways to stronger economic growth across the state. The project, Pathways to Prosperity, has been conducted in close partnership with the Office of the Governor of Wyoming and the Wyoming Business Council in order to help state and local officials overcome key challenges. Together, we’ve examined Wyoming’s economic landscape, and further delved into problems within the state’s housing, grants, fiscal, workforce, and energy systems.
Wyoming’s wealth of reliable data has been instrumental to project work, allowing the team to extensively leverage quantitative analysis to explore barriers to economic growth across the state. However, we’ve found that quantitative methods have their limits, especially as one moves from studying the economy in aggregate to understanding issues and opportunities in smaller, local economies. This is especially relevant when digging into complex problems and change processes. Mixed methods—the pairing of qualitative and quantitative research—has been crucial to making real progress in Wyoming. This pairing has been a two-way street. At times, qualitative analysis has built upon quantitative findings, by providing an intuitive, real-world explanation for statistical outputs. Other times, qualitative research has guided our data analysis, with qualitative hypotheses tested against the data.
Leaning into mixed methods approaches has been particularly valuable in tackling two key challenges in Wyoming:
- Weak housing supply growth in the face of clear demand
- Severe difficulties that municipalities encounter in winning and implementing federal grants
The housing challenge in Wyoming is characterized by a shortfall of new residential construction. Demand for housing is rising across the state, but residential home builders face unique challenges and added costs in home construction. Identifying and now working to relieve those challenges to residential construction has relied on regression analysis and price elasticities to identify the most housing-constrained markets. The quantitative results worked in combination with iterative qualitative research between local housing stakeholders such as residential construction companies and city planners, with the goal of untangling the complex relations between housing policies, public goods provision, and private sector incentives.
The grants challenge centered on the underutilization of federal funds across the state, particularly in rural municipalities. Grants are one of the few lifelines for under-resourced municipalities to finance projects needed for community resilience and economic diversification, such as infrastructure, local capacity building, workforce training, and more. Our goal has been to identify and alleviate the hurdles Wyoming municipalities face in accessing the substantial federal grant funds available, including the challenges in crafting winning grant applications. Qualitative approaches became important very quickly in this work as quantitative analysis focused on the outcomes of grant applications, rather than the step-by-step process of winning and implementing grants.
Looking back at a year of work through the Pathways to Prosperity Project, a few lessons stand out regarding the mixed methods approaches key to our research:
History’s Staying Power
Policy is formulated to address current needs. However, policy designed to solve yesterday’s problems continue to be enforced today, even when said policy no longer matches present-day challenges. This policy holdover distorts the proper functioning of today’s markets and today’s public goods. Development researchers can use a historical lens to understand why certain policies are in effect today despite failing to address today’s needs. In the case of Wyoming’s grants system, the state’s institutional setup was designed to take advantage of federal funds as they were disbursed for the pre-2021 norm, primarily via state agencies. However, recent spending packages under President Biden asked communities to apply directly to federal agencies for access to the majority of funds, with Wyoming municipalities failing to adjust. This hypothesis was evidenced in part in official figures, showing that today just 20% of federal funds are disbursed via states, compared to 75% disbursement pre-2021. Understanding the historical origin of certain policies and how societal challenges have shifted allows researchers to gain an understanding on the mismatch between policy and today’s needs.
Positive Deviance
A surprising success story, such as the entrepreneur in a failing industry or the growing city in a struggling economy, offers insight into how other actors may overcome similar challenges. Positive deviance is the phenomenon of an individual agent overcoming a constraint holding back the broader group. Understanding the exact challenges surmounted and the mechanisms to success provide actionable insight into the fundamental nature of the development challenge, as well as a clue to what a feasible path forward may be. The housing workstream explored cases of positive deviance to understand why certain municipalities enjoyed cheaper residential land prices than the rest of the state. Although quantitative analysis allowed the team to identify the positive deviants (i.e. municipalities with cheaper residential land), deep dives into the positive deviants provided insight towards why certain land markets enjoyed cheaper prices than others. We found that positive deviant municipalities boasted robust arterial infrastructure, which allowed for a higher supply of land to be viable for residential construction, in turn lowering prices. In contrast, municipalities with high residential land prices struggled to expand their arterial infrastructure beyond city centers.
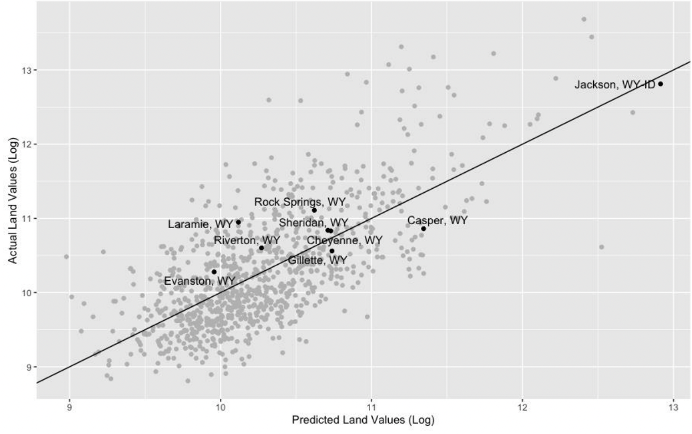
Gillette and Casper enjoy cheaper residential land than predicted. Both cities boast comparatively robust water and sewage systems. Source: Pathways to Prosperity Housing Note
Process Tracing
Quantitative analysis often overlooks dynamics within the change process, as numerical data tends to measure development outcomes rather than the process itself. Dissecting the underlying sequence of change with local actors elucidates when and where blockages impede the development process. Within our project work on housing, interviews with residential construction companies noted many issues that cropped up in the process of building a new subdivision. However, tracing the process of unsuccessful subdivisions identified two persistent blockages:
- When the developer was obligated to cover infrastructure costs that often are provided by the local government
- When the parcel was zoned to prohibit denser market-rate housing
Other difficult aspects within the construction process, such as finding a workforce, interest rate increases, or supply chain delays were problematic (and at times costly) but did not fully block construction. Conversely, we observed specific instances in which a parcel of land that was not hindered by these two blockages suddenly became available for sale. These cases enjoyed a comparatively smooth subdivision build-out.
Stakeholders as Analysts
Development researchers often do not belong to the society in which they are working. Although outside technical support is key for capacity-strapped governments, the loss of important local context should be minimized. The field can better leverage the contextual knowledge of local actors by incorporating a range of stakeholders into the research process itself. Local stakeholders add depth and uncover key insights often unseen by researchers arriving on assignment, such as providing intuitive explanations to data results. Better yet, any policy recommendation will be vetted for implementation feasibility and potential political support early in the research process. Our project work on grants grew out of biweekly task force meetings with grant applicants, grant funders, consulting firms, state government representatives, and local economic development officials. Joint research with the task force–including process tracing, discerning patterns in the evidence, trips to the field, and general brainstorming–ensured research findings leveraged the on-the-ground knowledge of stakeholders.
Concurrent and Existent Action Steps
When researchers take the time to explore what individuals and groups are already doing to try to overcome the problem, hard-won and innovative initiatives that could scale up or be stitched together often emerge. Similarly, piloting solutions oneself and iterating towards success identifies fundamental drivers of specific challenges and builds a targeted policy response. Problem-solving around the grants problem in Wyoming benefited from studying the different grant support programs already underway across the state, even though no existent initiative was intended to be a comprehensive solution. Key findings pointed to direct support as more useful than online webinars. Our team even worked through a live federal grant application with stakeholders to understand what type of support was most needed. Development research greatly benefits from studying action steps already taken to resolve the problem, as well as piloting initial solutions.

Growth Lab researchers visit the Wind River Indian Reservation in February 2023.
Targeted Surveys
The solution to a lack of targeted data can be to gather data, often quickly. Although a large-scale, fully representative survey is time-intensive and costly, surveys leveraging existing membership groups are straightforward and target a relevant group of respondents. Online tools such as Google Forms make the leg work minimal. Research on grants in Wyoming leveraged an existing state-wide conference on federal funding opportunities to run surveys with attendees, comprising grant writers and administrators from across the state. Although a state-wide representative survey would have been infeasible, our limited and targeted survey provided quick insights from relevant stakeholders with targeted research questions such as the number of staff dedicated towards grant writing, the grant sources they were most familiar with, and the prioritization of specific challenges in the process of winning a grant. The survey results were, in turn, analyzed with existing figures such as federal grant disbursement by municipality to give more complete and relevant quantitative analysis to pair with qualitative findings.

Targeted surveys allowed the team to gather pointed and unique data from key beneficiaries. Source: Pre-Summit Survey Results
Complex development challenges are only partially understood through data analysis. Mixed methods approaches have allowed the Wyoming team to explore constraints in the development process with added rigor and depth. Importantly, mixed methods not only allow for a more comprehensive analysis but facilitate policy action by building a sense of ownership among local actors. The relationships established during the research process develop the political capital and on-the-ground partnerships crucial for implementing proposed initiatives. Development researchers employing mixed methods approaches will dissect and address complex challenges with new clarity, ensuring their research leads to practical, impactful solutions.
Top photo: Growth Lab team members visit the Capitol Building in Cheyenne in September 2022.
Boosting future economic growth through diversification into more sophisticated industries: China, Viet Nam, Uganda, Indonesia and India leading the way
By: Timothy Cheston and Lorena Rivera León (World Intellectual Property Organization)
The journey towards economic development hinges upon the acquisition and utilization of productive knowledge, particularly in increasingly sophisticated – aka complex – industries and products. To chart a course toward robust economic growth, economies must effectively diversify into products that require rich and deep know-how which only a few other countries master, including innovation-intensive sectors such as information and communication technologies (ICTs), pharma, medical technologies, and different high-tech engineering products.
Embracing this premise, the Economic Complexity Index (ECI) of Harvard University, an indicator used in the Global Innovation Index (GII) 2023, evaluates economies’ competitive standing in terms of the advanced nature and diversification of their exports.
Based on this, Japan, Switzerland, Germany, the Republic of Korea, and Singapore top the rankings (see Figure 1). The Czech Republic, Austria, Sweden, Hungary and the UK (see Table 1) follow. The US ranks 12th.
Read the entire blog on Global Innovation Index Insights >>
Accelerating Sustainable Growth in Albania through Targeted Investment Promotion
Authors: Daniela Muhaj and Tim O’Brien
“[Targeted investment promotion] requires people in and out of government to imagine
what is not yet there, figure out what is needed to establish it, and determine whether
it would be both feasible and valuable to society.”
– Ricardo Hausmann
Between 2014 and 2018, the Albanian economy experienced accelerating growth and structural transformation, which has been tied to the arrival of foreign companies (Hausmann 2018). Our updated growth diagnostic tracks Albania’s recent growth history and describes key steps needed to seize additional growth opportunities. Albania has the potential to realize much more and more diversified foreign direct investment (FDI), which will be critical to accelerating sustainable growth in the period of global recovery from COVID-19. The Growth Lab team coordinated with the Government of Albania to research, develop tools and build capacity toward this end.
TIP is a coordinated approach to addressing the information
problem in attracting efficiency-seeking FDI that
can thrive without costly incentives.
The Government of Albania (GoA) is pursuing various investment promotion and attraction strategies (see Table 1). The targeted investment promotion (TIP) approach complements existing tools by capitalizing on Albania’s many existing comparative advantages to attract efficiency-seeking FDI. TIP would not displace Albania’s Strategic Investment Law, which provides incentives for certain investments, nor the activities of the Albanian Investment Corporation (AIC), which aim to expand the country’s comparative advantages. Efficiency-seeking FDI — global companies that expand into Albania to serve global markets because it makes them more productive — will not need extensive tax incentives, regulatory exemptions, or other subsidies. In fact, an overreliance on these approaches can — and probably does — crowd out firms that do not want or need to rely on government support (see Figure 1). Leveraging targeted investment promotion within Albania’s growth strategy would lead to more jobs, better quality jobs, faster convergence with the income levels of the rest of Europe, and ultimately less outmigration.
Table 1: Three Distinct Tools for Investment in Albania
| Government Tools | Goal / Type of Investment / Requirements |
| Targeted Investment Promotion (TIP) Network |
To overcome the information scarcity or misinformation problem in attracting efficiency-seeking FDI that can thrive in Albania without costly incentives.
|
| Law on Strategic Investments |
To utilize a private investment incentive package that would deliver very large economic benefits, which may not be commercially viable in Albania without such incentives.
|
| Albanian Investment Corporation (AIC) |
To develop investment projects that are not commercially viable by the private sector because they require the active participation of the public sector in some form.
|
1 Promotion does not stop with first contact or the generation of a “lead.” It must continue in the form of proactive follow-up (or “facilitation”). This facilitation involves both connecting specific companies to specific locations where they can set up operations and helping companies to efficiently solve specific delays and roadblocks that may arise through coordination with various public sector entities.
Figure 1: Key Elements of Targeted Investment Promotion in Albania
| Targeted | Investment | Promotion |
| Identify companies through an objective process to prioritize those that would be both likely to thrive in Albania and deliver significant economic benefits. | Focus on efficiency-seeking FDI – business investments, which can expand in Albania because they can thrive in producing goods and services that they sell not only in Albania but also to the rest of the world. | Engage in proactive and iterative promotion efforts, whereby a coordinated network of Albanian officials’ contacts companies that could thrive in Albania. |
| Make clear and well-developed cases (pitches) as to why and how a foreign company can succeed by investing to expand their business operations in Albania. | Prioritize companies that employ Albanian workers, and seed industries and innovation in the Albanian economy that drives up wages and builds the economy of the future. | Support the process of business entry and start-up of operations without the need for use of tax incentives, free land, regulatory exceptions, or other incentives, as these companies are poised to be profitable without such giveaways. |
Source: Growth Lab elaboration.
To translate the concept of TIP into practice, our Policy Research and Digital Development & Design teams worked closely with the Albanian Investment Development Agency (AIDA) to build several tools to enhance the Government of Albania’s ability to implement TIP, and then convened working meetings to begin to apply them. Our goal was to collaboratively identify several potential starting points where the AIDA Research Unit could begin to develop targeted pitches and informed strategies for outreach. These starting points were generated through an objective process that drew on evidence from our Albania Industry Targeting Dashboard, which can be used together with the Atlas of Economic Complexity. Both are publicly available tools that can be used to help identify global businesses whose investment would be both viable in Albania and attractive to Albania. Our initial analysis indicated that the following industries represented promising starting points for AIDA to organize TIP activities around:
- electrical wiring and devices
- plastics and derivative products
- agriculture exports, food, and seafood processing
- software development, data processing, hosting and related activities.
Investment starting points were identified through an evidence-based
process drawing on insights from our collaboratively
developed open-source tools.
Exploring One Example
Once a broad industry is identified, the process then requires a more in-depth research dive to build a business case and a customized investment pitch. Let’s take a closer look at the case for expanding software development, data processing, hosting and related activities. This is an industry with high viability and very high attractiveness in Albania, and a prospective area of dynamic international investment in the wake of the COVID-19 pandemic. Given the development and growth of Business Processing Outsourcing (BPO) in recent years, Albania already has firms intensively involved in business services in comparison to the rest of Europe. While the growth of the sector has been mainly driven by call centers and customer-service related activities, recently higher skilled opportunities such as accounting and auditing services, data processing and web services have emerged. There are examples of successful companies who have been able to invest and scale in Albania (see mozenda as an example). However, the opportunities for moving beyond the call center model to more complex business outsourcing opportunities are vast but poorly identified to date.
The types of questions that could be asked while conducting additional research to identify specific opportunities in software development, data processing, and related activities include:
- What are the higher end business services that have already emerged in the past few years and how can they be scaled? Are there opportunities to collaborate with leading companies in Albania that would now like to see the ecosystem grow to develop sophisticated pitches to other companies?
- What additional opportunities does the existence of accounting, web services and data processing activities unlock? What are the main regional and global companies in these areas? Who has expanded into the Balkans in recent years? What are their business and expansion goals? Do they match Albania’s comparative advantage?
- What emerging sub-sectors and applications are scaling because of COVID-19? Among these, where might Albania have the greatest viability?
The proposed list of starting investment opportunities and the example outlined above are far from exhaustive. They merely provide some ideas with which to start. The process of identifying opportunities and generating customized pitches should be ongoing and iterative within and across targeted industries.
Investment starting points were identified through an evidence-based process drawing on insights from our collaboratively developed open-source tools.
Coordinating within Government to Coordinate with New Investors
It is also important to recognize that targeted investment promotion in practice is not something that can be done by isolated individuals but rather requires a coordinated network of government actions. Albania already has several parts of a network in place (see Figure 2), including AIDA and numerous ambassadors abroad that have been trained in economic diplomacy. AIDA also utilizes the internal e-Invest platform as a tool for coordinating the network to ensure that investment leads receive appropriate follow-up attention and that progress through the investment process is tracked. This network has allowed for some improvement in Albania’s investment promotion. However, the fruits of investment promotion remain limited because the network’s actions are not targeted. Addressing these bottlenecks and expanding the investment promotion network though efforts like the recent Connect Albania platform, which mobilizes diaspora members in advancing investment attraction efforts, could result in many more promising leads and an effective facilitation process.
An effective TIP practice requires a coordinated network of institutions and stakeholders that can pursue well-identified investment
leads by employing a consistent approach.
Growth Lab research and capacity building in Albania has found that the key step needed to make TIP fully functional in Albania is a strong coordination mechanism at the top. This could be an individual appointed by the Prime Minister with a specific mandate to activate TIP, who would be authorized to develop KPIs for various parts of the network, monitor actions, and direct funding to fill in gaps that emerge. Importantly, TIP would be extremely inexpensive for its expected benefits in stronger growth and job creation. Directed spending on the order of a few hundred thousand dollars per year to expand staffing in different units and improve information tools would be expected to increase the rate of economic growth and income levels across Albania for years to come.
Figure 2: Schematic of the Investment Promotion Network in Albania
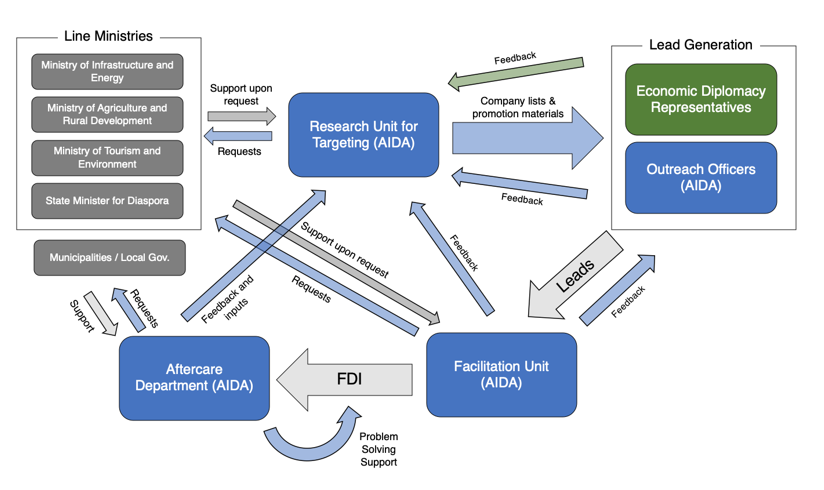
Source: Growth Lab elaboration.
A successful TIP approach, which should be iterative and adoptive over time, has the potential to unlock complementary investment and growth opportunities in Albania and beyond. As developing countries around the world gradually and unevenly emerge from the COVID-19 pandemic, pressures to deploy scarce fiscal resources wisely will continue to amount. With limited room for costly incentives, countries can utilize a targeted approach to investment promotion to attract the type of investments that can rightly serve their development needs. Instead of merely focusing on compensating desirable investors for what a country lacks, governments can and should target investors that can gain efficiency and scale based on country-specific comparative advantages. TIP provides a framework for organizing an effective investment promotion network that can systematically identify and pursue promising growth enhancing opportunities.
The Limits of the Rule of Law to Address Systemic Corruption
José Ignacio Hernández for the Corruption, Justice, and Literacy Program website
Venezuela is considered one of the world’s most corrupt countries. A common strategy to address its corruption, and one advocated by the likes of the Council on Foreign Relations no less, is “reinstating the rule of law.” Similarly, the International Commission of Jurists has proposed to “recover the country’s democratic institutions and the functioning of the rule of law.”
Without a doubt, the rule of law should be restored in Venezuela to tackle corruption. The real question to ask, however, is this: What is the root cause of corruption in the country? If the cause is flawed rules, then, yes, the solution should be institutional reform that creates new rules and institutions. This in fact is the path Maduro’s regime has followed, while also recommending a legislative overhaul to boost anti-corruption policies.
Plenty of evidence exists, however, to conclude that flawed rules are not the primary driver of systemic corruption.
And, furthermore, the problem with any strategy focused on institutional reform to reinstate the rule of law to promote anti-corruption policy lies in the assumption that the branches of the Venezuelan Government possess the capability to enforce the policy.
Instead, the root cause of the country’s corruption problem resides not in its laws but in the fragility of the Venezuelan state. The first condition to reinstate the rule of law is that the state should have the capability to enforce the rule of law. And that condition is missing in Venezuela.
That is why, according to Matt Andrews, in the absence of a capable state, institutional reforms will have minimal impact; state fragility will prevent effective enforcement of the new institutions. In Venezuela, even the best comptroller under the proper framework would all but certainly fail to implement successful anti-corruption policies.
Rather than push for institutional reform to reinstate the rule of law in Venezuela, we should diagnose and measure the fragility of the state. As in Lampedusa’s novel The Leopard, any anti-corruption strategy based only on an institutional reform will “change everything” to allow everything to stay “as it is.”
The Growth Lab’s Most Important Academic Papers of the Past Decade on Economic Complexity
This blog post originated as a thread on Twitter. Written by Frank Neffke.
At the Growth Lab, an interdisciplinary team of researchers explores the foundations of economic growth from both an academic and applied angle.
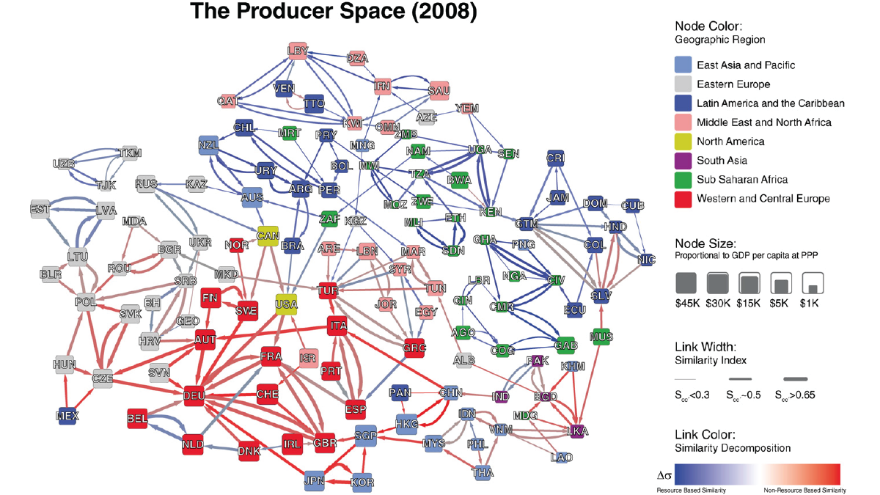
Our Economic Complexity approach starts from the assumption that technology takes the form of tools, codes and knowhow. Because each individual can only acquire so much knowhow in a lifetime, a country’s collective knowhow grows by distributing different bits of knowhow across different brains. In that sense, countries know more, because individuals in them know different. Complex places are places that can mobilize a diverse body of knowhow. Complex products are products that require more knowhow. Two core quantities developed at the Growth Lab are the Product Space (a network that links products or industries with similar capabilities requirements) and the Economic Complexity Index (ECI, a measure of how much knowhow an economy can mobilize).
Since knowhow is often tacit, embodied in skills and routines, knowhow diffuses with people and teams of people. However, because knowhow is distributed across different people, to use it, it needs tying back together by firms, cities, or countries.
Our research established that this view has testable implications that are borne out in the data. In our work, we explore how knowhow grows at the local level, how it diffuses and how it is coordinated within individuals, firms, and value chains. Below, we list our most important academic papers of the last ten years on Economic Complexity.
The Network Structure of Economic Output (2011)
Modeling complexity: Ricardo Hausmann and César Hidalgo describe the economy as a tripartite network connecting places to the capabilities they have and products they can make, explaining stylized facts about exports and why complex worlds feature a poverty trap.
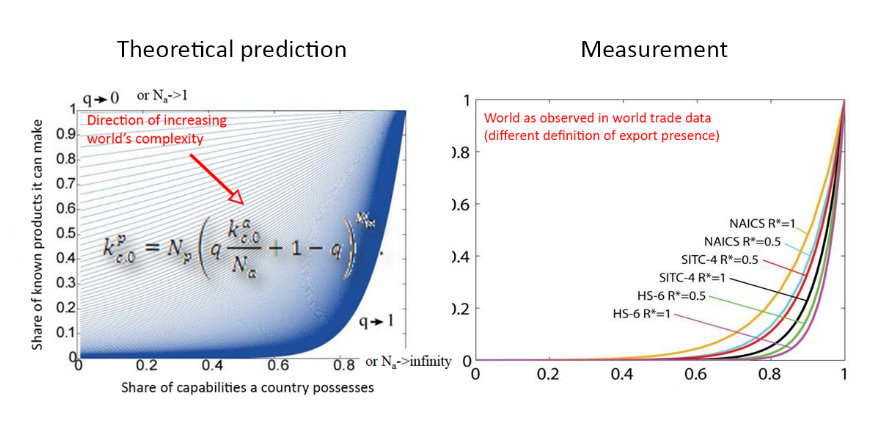

Explaining the Prevalence, Scaling and Variance of Urban Phenomena (2016)
Taking the model to cities, Andres Gomez-Lievano, Oscar Patterson-Lomba and Ricardo Hausmann ask: Why do larger cities exhibit higher wages and more innovation, but also more rare diseases and crimes? Because these all are socially complex phenomena.
The Atlas of Economic Complexity (2011)
Authored by Ricardo Hausmann, César Hidalgo, Sebastian Bustos, Michele Coscia, Alex Simoes and Muhammed Yildirim, the Atlas is a guide to the world of economic complexity through trade data: explanations of core concepts, empirical tests and country-specific visualizations. [Explore the tool]
A Structural Ranking of Economic Complexity (2019)
Measuring complexity: Ulrich Schetter embeds a structure of log-supermodular productivities into a multi-product Eaton-Kortum model to show that under these conditions the Economic Complexity Index really does measure complexity.
Implied Comparative Advantage (2014)
The Product Space revisited: Hausmann, Dan Stock and Muhammed Yildirim construct a Ricardian model to explain why growth of exports in countries (or of industries in cities) can be predicted from product and country spaces.
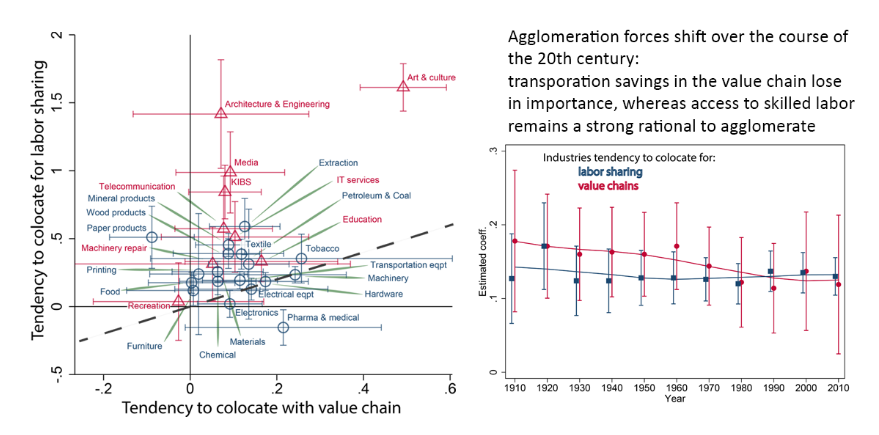
Why do Industries Coagglomerate? How Marshallian externalities differ by industry and have evolved over time (2016)
Neave O’Clery, Dario Diodato and Frank Neffke dissect the industry space: Why do industries collocate? It depends: services to share workers, manufacturing to be close to their value chain. But over time, sharing workers increasingly dominates.
Skill Relatedness and Firm Diversification (2012)
Firms diversify into industries for which their workers have the right skills. Frank Neffke and Martin Henning show that skill-relatedness, which they infer from large-scale data on how people change jobs across industries, predicts firm diversification 60x better than value chain linkages.
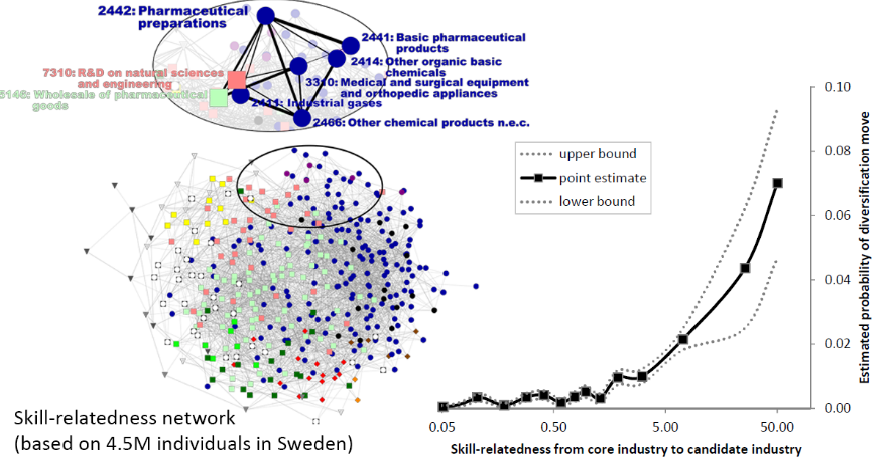

Automation, Skills Use and Training (2018)
Capabilities of machines: Ljubica Nedelkoska and Glenda Quintini estimate the risk of automation for 32 countries, representing close to 600M jobs. It is the jobs of the young, not the old that are more at risk of automation.
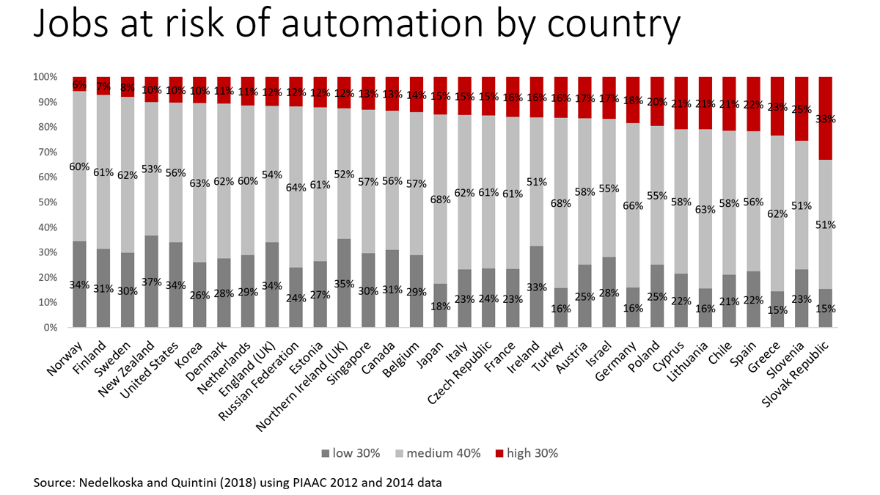

Welcome Home in a Crisis: Effects of Return Migration on the Non-migrants’ Wages and Employment (2018)
Diffusing knowhow through return migration. Hausmann and Nedelkoska show that the massive return of relatively low-skill, yet experienced Albanians from Greece in the financial crisis didn’t lead to unemployment, but to new jobs & wage increases.
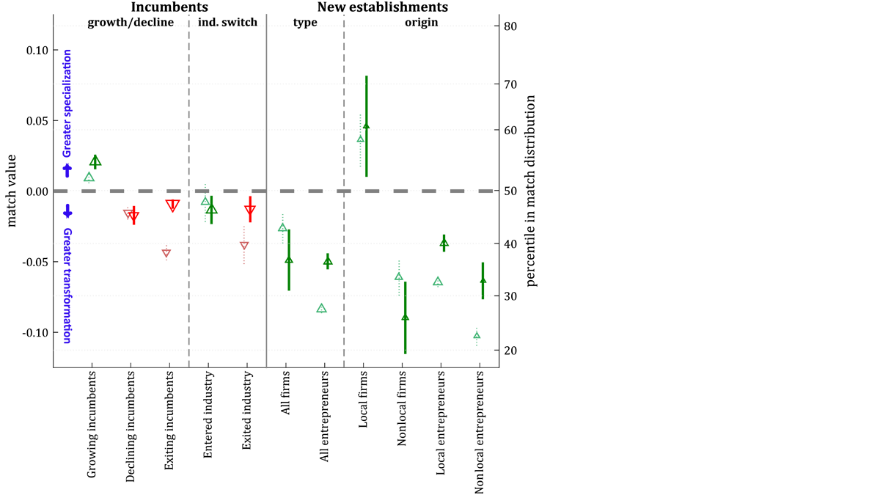
Agents of Structural Change: The Role of Firms and Entrepreneurs in Regional Diversification (2017)
How do regions make long developmental jumps? Frank Neffke, Matte Hartog, Ron Boschma and Martin Henning show that regions change mostly by the creation of new economic establishments. However, the most transformative diversification is not due to new establishments of local firms or local entrepreneurs, but due firms and, to a lesser extent, entrepreneurs from outside the region starting new establishments and therewith transferring new capabilities to the region from elsewhere.

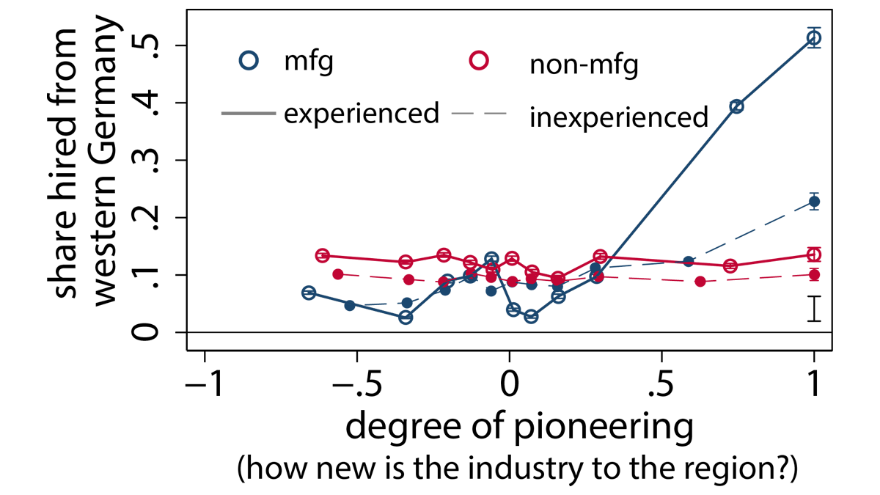
The Workforce of Pioneer Plants: The Role of Worker Mobility in the Diffusion of Industries (2019)
How did former East Germany reindustrialize? Using social security data, Hausmann and Neffke show that the pioneer firms in the east that brought in new manufacturing industries relied heavily on the sudden possibility of accessing human capital in the west: the majority of experienced workers in these firms did not come from eastern Germany, but moved in from western parts of the country.
Neighbors and the Evolution of the Comparative Advantage of Nations: Evidence of International Knowledge Diffusion? (2014)
Learn from your neighbors. Dany Bahar, César Hidalgo, and Ricardo Hausmann show that countries diversify their exports by moving into products that their neighbors were already exporting. This paper also introduces the country space: a network linking countries with similar exports.

Knowledge Diffusion in the Network of International Business Travel (2020)
However, learning doesn’t require permanent proximity. Michele Coscia, Frank Neffke, and Ricardo Hausmann show how transient proximity diffuses knowledge through business travel, helping countries diversify into the industries of their visitors’ home countries. [Explore the research]
The Value of Complimentary Co-workers (2019)
Coordinating knowhow. If global knowledge keeps growing, we need to divide it across ever more people. As Frank Neffke shows, the result is growing interdependence: the value of your skills comes to depend on how well your co-workers’ skills complement yours. [Explore the research]
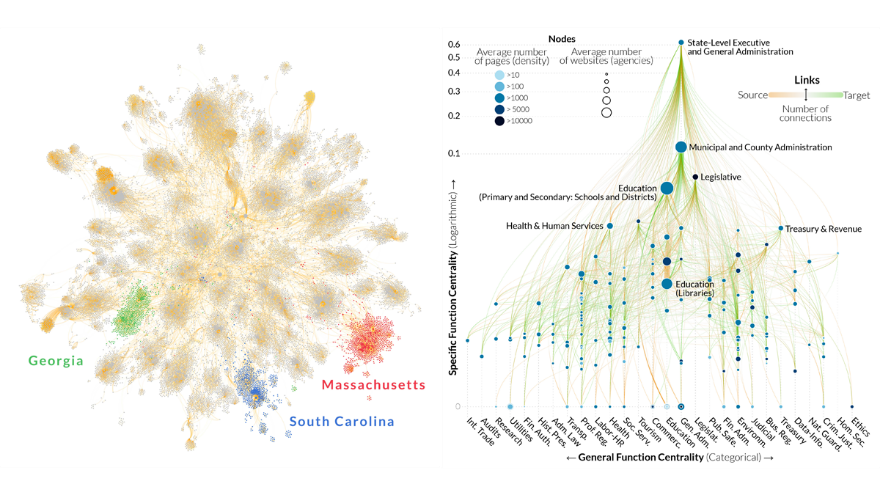
Functional Structures of US State Governments (2018)
State capabilities. Steve Kosack, Michele Coscia, Evann Smith, Kim Albrecht, Albert-Laszlo Barabasi and Ricardo Hausmann reconstruct the online digital footprint of US state governments and show that it mostly reflects not ideology or location but a state’s economic structure. [Learn more]

Horrible Trade-offs in a Pandemic: Lockdowns, Transfers, Fiscal Space, and Compliance (2020)
Fighting COVID-19 involves horrible trade-offs. Ricardo Hausmann and Ulrich Schetter show why they are particularly excruciating in countries without unlimited access to foreign credit and why there is a dire need of massive financial support. [Learn more]
You’ll find all of our publications in the Growth Lab’s repository Our research agenda keeps deepening & expanding: we are working on theoretical foundations, the diffusion, adoption and upgrading of capabilities, innovation, changing tasks and occupations, localization and more. Stay tuned!
The Diaspora Brain Trust: A Study of Albanian Talent Around the World
Tariffs, Tea, and Trade: Research Notes from Sri Lanka
Does the Sri Lankan Economy Need More University Graduates?
By Ljubica Nedelkoska, Tim O’Brien and Daniel Stock
Download PDF | Listed to the podcast interview
SUMMARY OF FINDINGS
Sri Lanka has exceptionally low rates of tertiary education admission and graduation for its level of economic development. Many have identified this as a roadblock to Sri Lanka’s economic competitiveness. Using six years of Sri Lanka’s Labor Force Survey, we study the evidence of shortages of tertiary educated workers. Our analysis casts doubt on the existence of a general shortage of university graduates in spite of the low university admission and graduation rates. We find that the majority (77%) of university graduates are employed by the public sector (government and semi-government), where they enjoy job security and other benefits but earn wages that are only a fraction of what is paid in the private sector. On average, college graduates in the private sector earn 1.6 times higher wages than college graduates in the public sector. Moreover, the wages of college graduates in the public sector are only between a quarter and a third higher than those of A-level graduates in the same sector. A minority (23%) of college graduates are employed by the private sector, where they earn significantly more than those with only A-levels – 66% in the case of men and 128% more in the case of women. These very high wage premiums in the private sector, combined with very low unemployment rates of college graduates, suggest shortages of particular types of tertiary education. This seems to be the case with ICT professionals and ICT technicians, business professionals, science and engineering professionals, and various managerial occupations. This suggests that education policy should focus on addressing the shortages in these areas, as opposed to expanding tertiary education more generally. A general expansion of higher education without a focus on these fields could actually further lower the already low returns to a tertiary degree in the public sector, without addressing any issues of Sri Lanka’s economic competitiveness.
BACKGROUND
Sri Lanka’s gross enrollment ratio (GER) in tertiary education reached close to 20% in 2015, placing it among the lowest rates of all middle-income countries. The average GER among middle-income countries is 33%, and all countries in the region, including India and Indonesia, have significantly higher tertiary education enrollment rates than Sri Lanka. This has led many to believe that Sri Lanka has too few individuals with tertiary education. In its flagship publication “Sri Lanka: State of the Economy 2017,” researchers at the Institute of Policy Studies in Sri Lanka identified skill gaps in the educational system as one of the key roadblocks towards higher competitiveness of the Sri Lankan economy. The report reads: “As of 2014, only 5 percent of 20-24-year olds were enrolled in a university, while another 8 percent were enrolled in other educational institutions and only 3 percent of the same age group were enrolled in technical education and vocational training (TVET) courses.” It goes on to explain that the main reasons for these low enrollment rates are capacity constraints of the state university system together with the low level of development of private sector education and the TVET system. In the same vein, the Government of Sri Lanka agrees that “education and skills development are currently inadequate to sustain growth through knowledge-based, competitive economic activities” and plans to increase access to secondary and tertiary education (Vision 2025).
While education serves various important roles such as intellectual enrichment, social mobility and social status, the primary purpose of education from an economic perspective is to make us more productive on the labor market. Most economists believe that the positive returns to education (i.e., the wage premium associated with an extra year of education keeping other factors constant) observed worldwide suggest that education helps companies become more productive and, in return, these companies are willing to pay higher wages for better-educated employees.
If too few university graduates is a key constraint to higher competitiveness of the economy of Sri Lanka, we would expect to see companies in the private sector fiercely competing for those few new graduates that emerge each year from Sri Lanka’s higher education institutions. As a result of this competition, we would expect the unemployment rates of university graduates to be low, and the wage premium they are paid to be high. These two characteristics would together give a clear signal that Sri Lanka is facing shortages of tertiary education graduates.
ARE SRI LANKAN UNIVERSITY GRADUATES EASILY FINDING JOBS?
The average annual rate of net university graduates inflows into the labor market between 2011 and 2015 based on Labor Force Survey (LFS) data was around 23,000. On the aggregate, there were about as many net new jobs created for these graduates over the same time period, suggesting a very high job placement rate. As a result, the employment rates for highly educated men remained very high (about 94%), while those of highly educated women even increased, from 73% in 2010 to 84% in 2015 (Figure 1). These aggregate patterns indeed suggest that the labor market of university graduates is tight.
Figure 1: Unemployment and non-participation rates of university graduates and postgraduates by gender
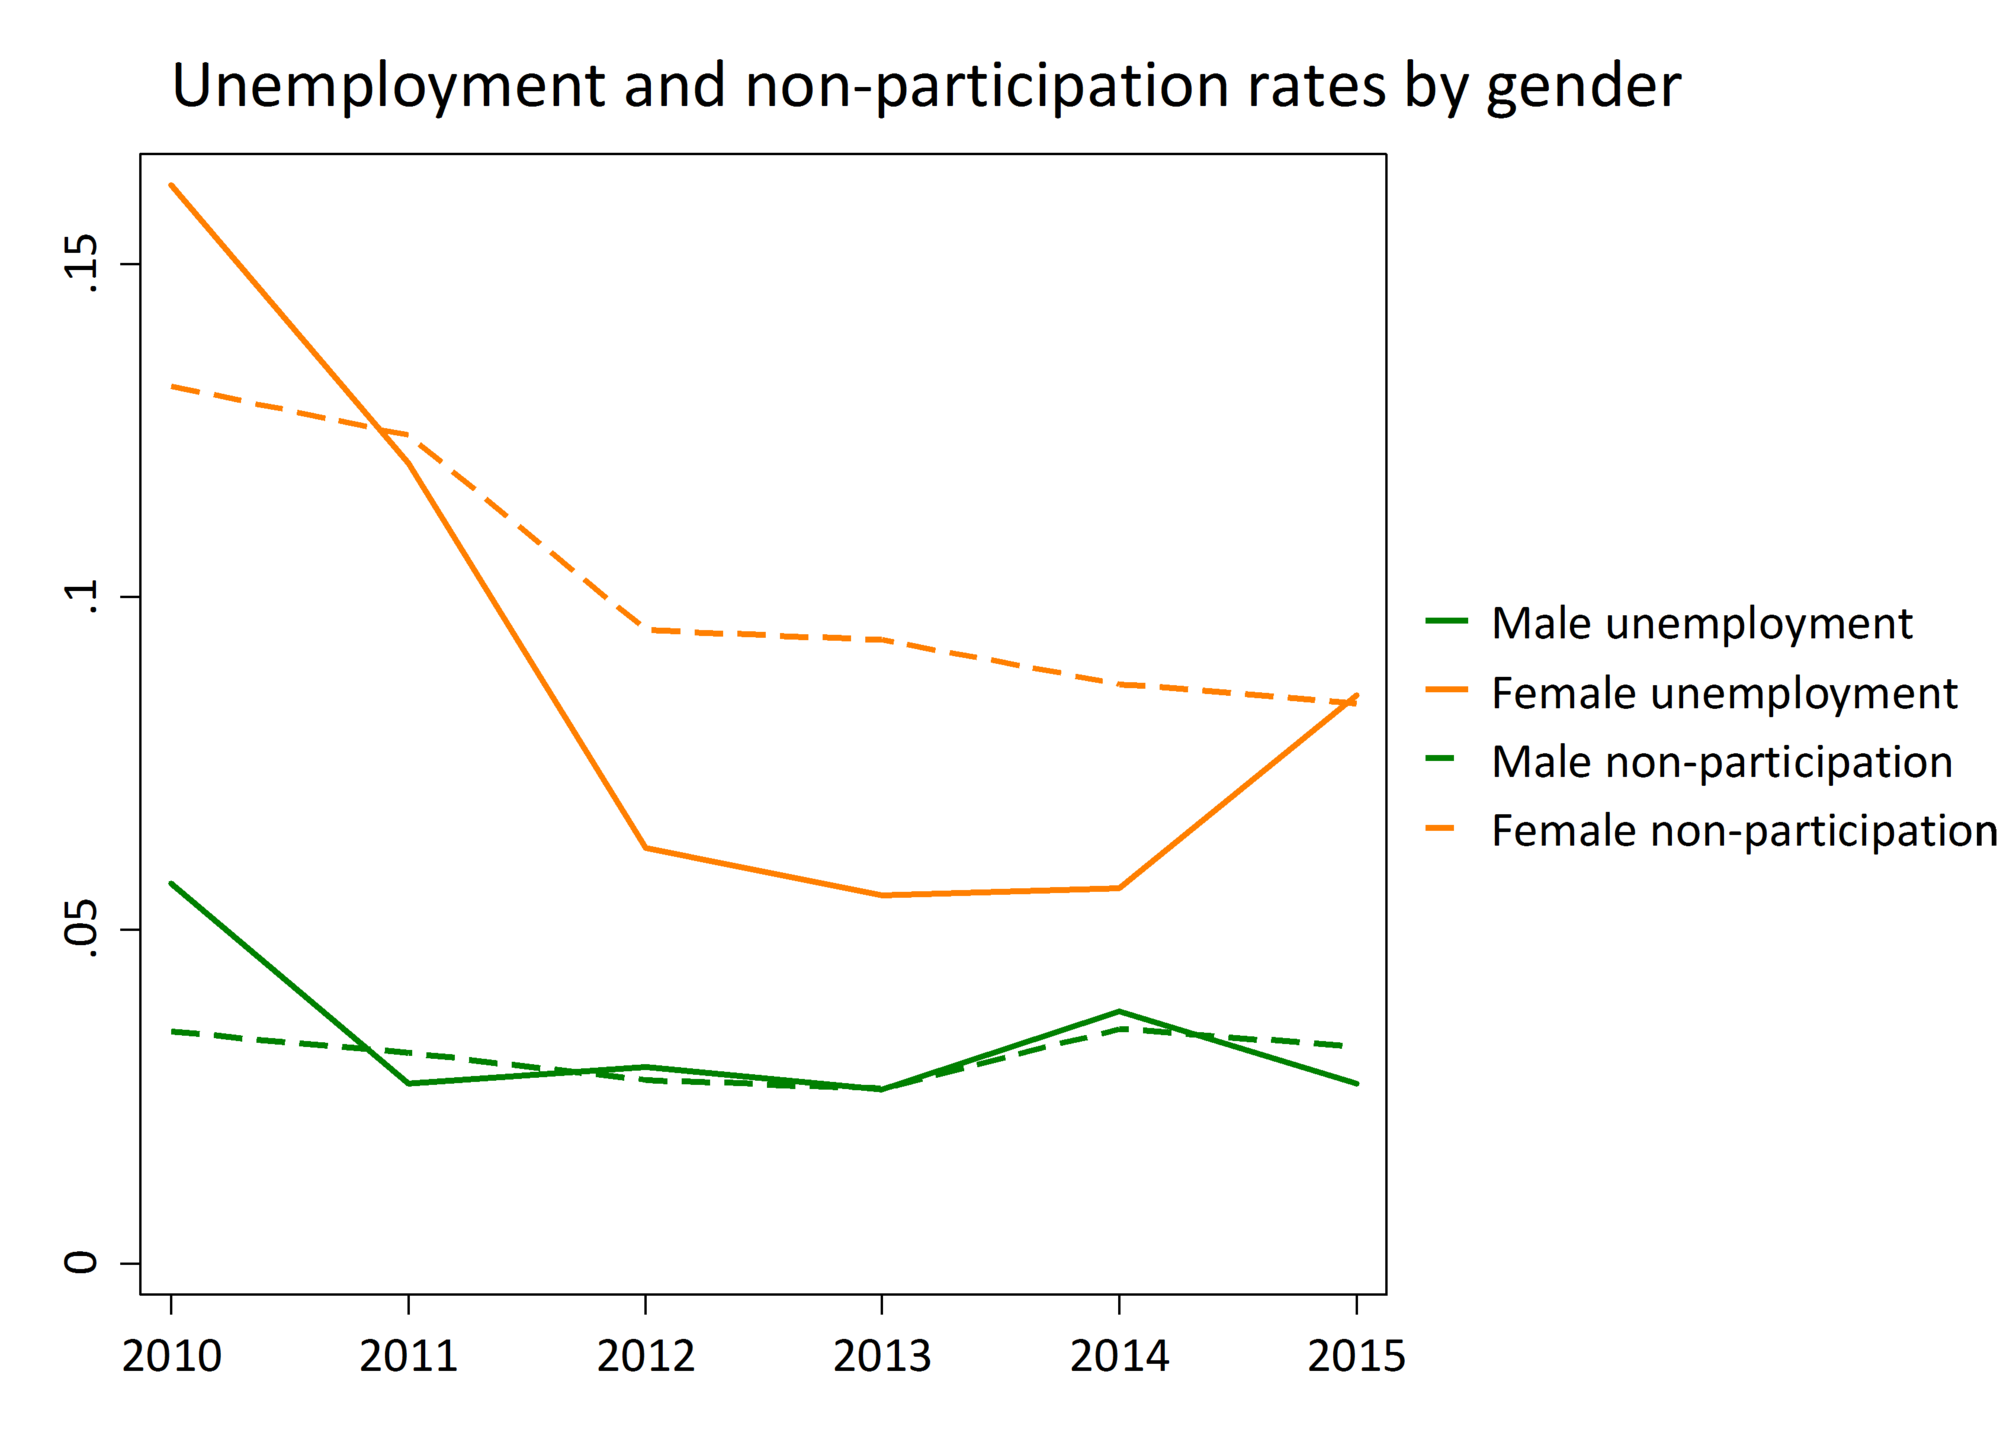
Source: Labor Force Survey (LFS) Sri Lanka 2010-2015. Note: Includes 15-65 year olds, all higher education levels and institutions.
DO UNIVERSITY GRADUATES RECEIVE HIGH WAGE PREMIUMS AT THE JOB?
As a reference, a college graduate in OECD countries, where the supply of tertiary educated is significantly higher than in Sri Lanka, earns about 57% more than a counterpart with no more than a high school education. The United States has earnings premium on the high end at 77%. In Sri Lanka, across all sectors, the premium to tertiary education over A-levels was 51% in 2015 (Figure 2), which is decent, but below the OECD average. Given the low supply and high rate of employment of university graduates, one would expect to see higher wage premiums. This leaves us somewhat puzzled: why should a country with drastically lower supply of university graduates than OECD countries have lower than average returns to tertiary education? Such pattern could indicate that the education obtained through the university system is not particularly valuable to the employers. The average premium could also disguise important differences in the returns to a tertiary degree among different groups of graduates. We think that the group distinction that will help us best explain the above patterns is the one between university graduates who opt to work in the public sector and those who opt to work in the private sector.
Figure 2: Premium of a college degree over A-levels
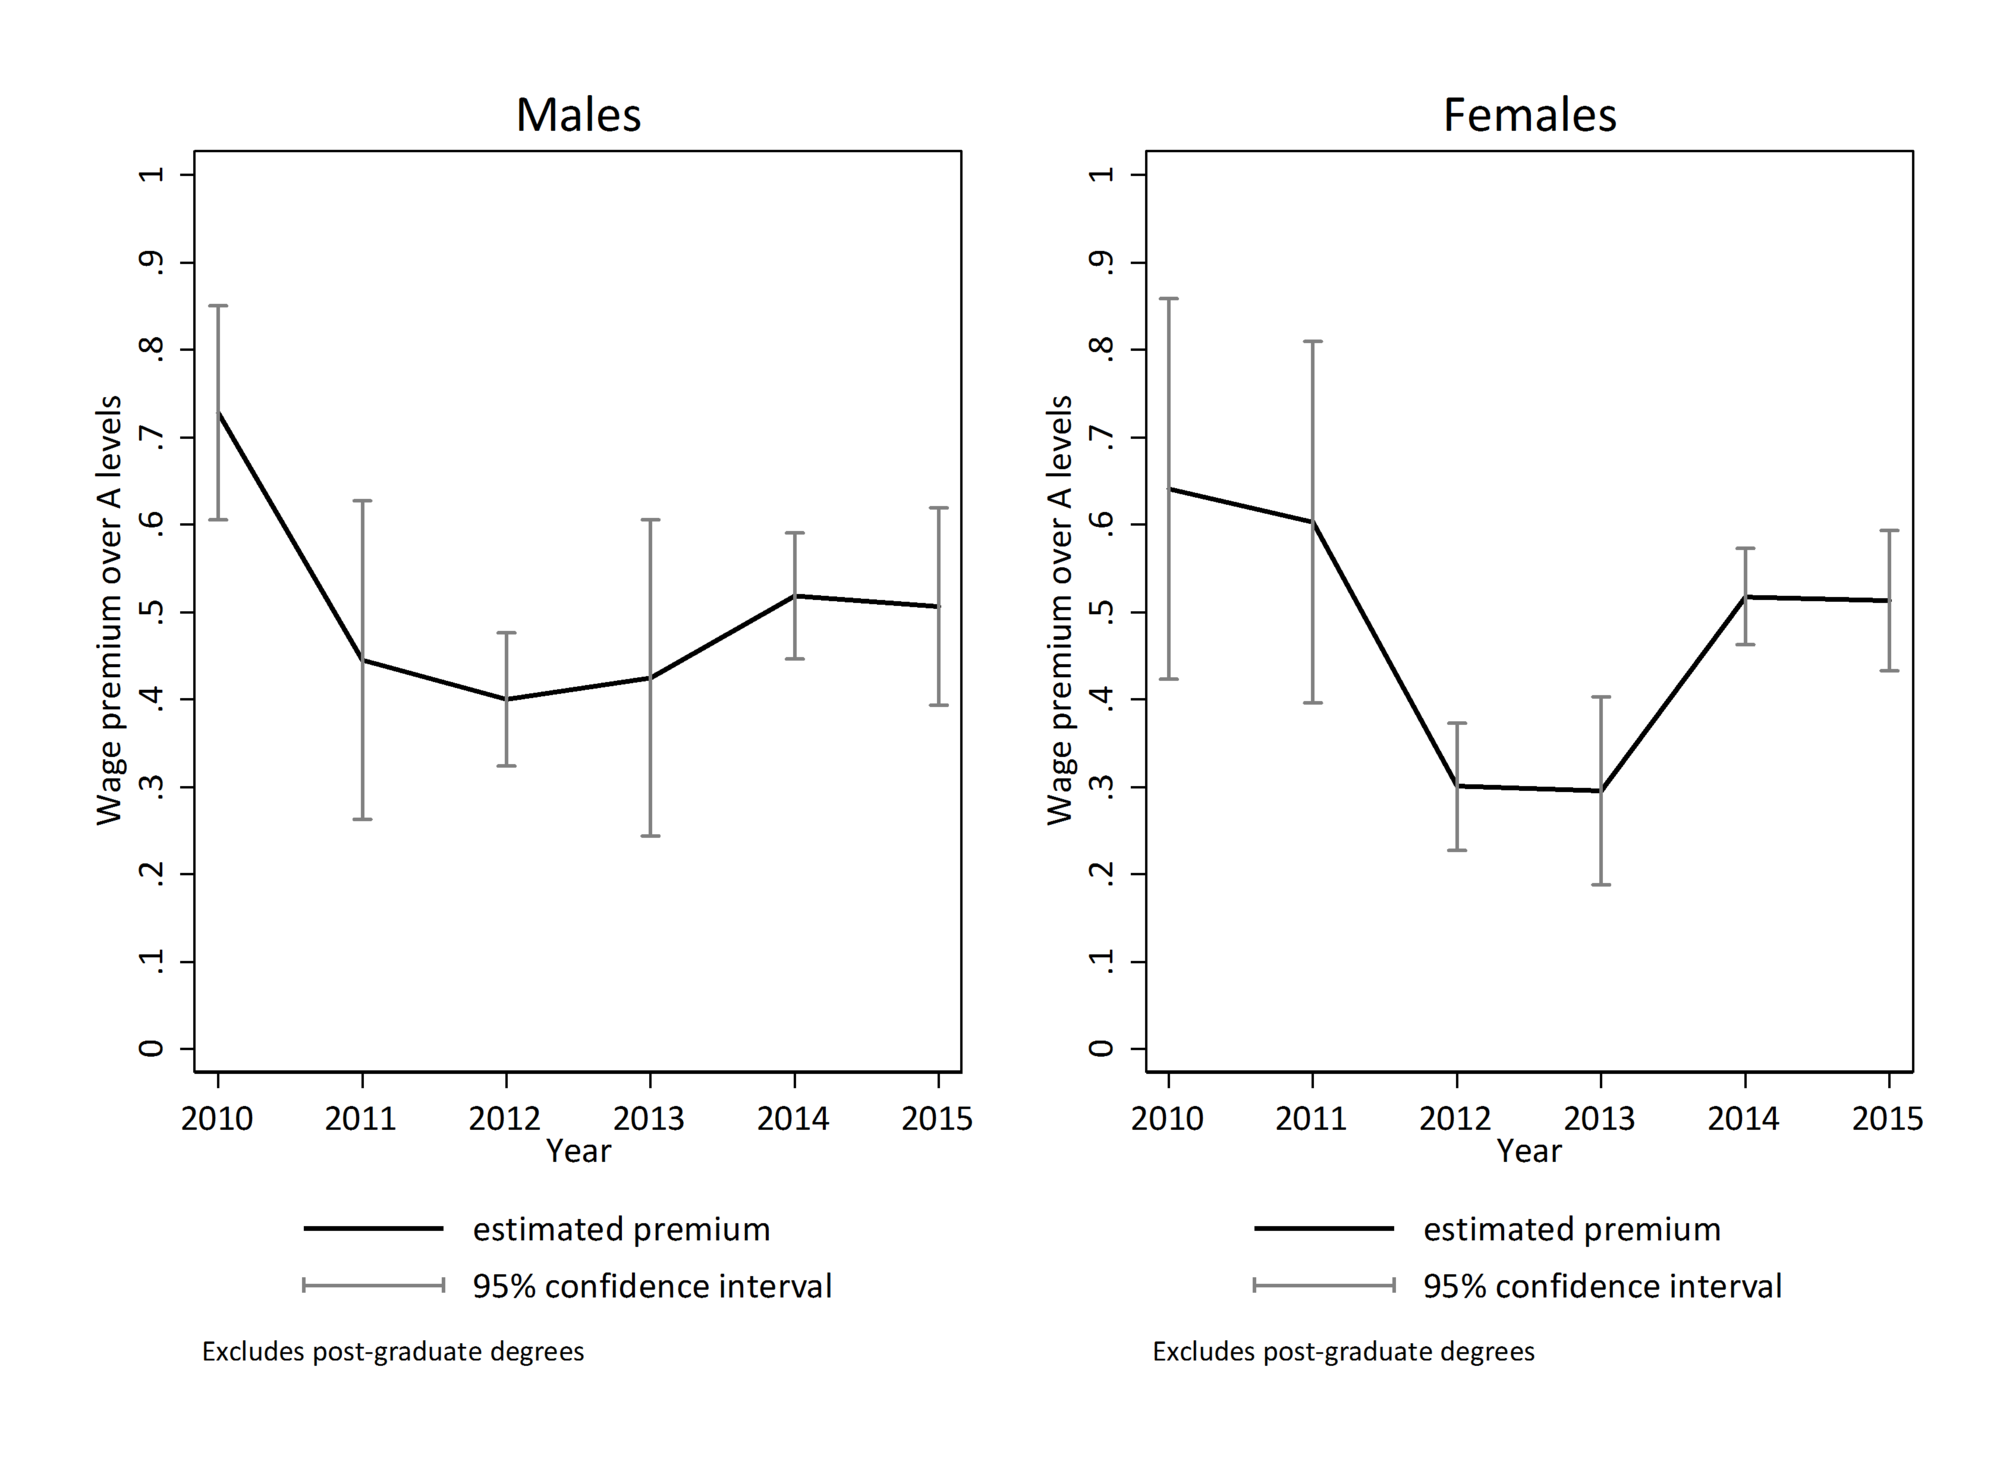
Source: Labor Force Survey (LFS) Sri Lanka 2010-2015
Note: Includes 15-65 year olds. To keep the group of college graduates homogenous, the premium is estimated for those with Bachelor’s degrees only, i.e., we exclude those with post-graduate degrees. Each estimate is the coefficient of a dummy variable indicating whether a person completed a Bachelor’s degree from a Mincer regression that controls for potential work experience and labor market entry cohort effects. Separate regressions were run for each year and gender combination. The reference educational category is those with completed A levels. The dependent variable is the log of the real hourly wage.
In 2015, the private sector only employed 23% of all university graduates, while the government and the semi-government sector employed the other 77%. This casts a doubt on the claim that the private sector is hungry for university graduates in general. The patterns of premiums to a college degree by sector introduce another layer of complexity to the story. The premium is low in the public sector, where college-educated men earned a 36% premium over A-levels and college-educated women earned a 25% premium over A-levels in 2015. Whereas in the private sector, college-educated men earned a 66% premium over A-levels and college-educated women earned a whopping 128% premium (Figure 3). A further comparison of the university graduates in the public versus the private sector shows that a male university graduate, on average, earned 1.5 times more per month in the private sector than in the public sector, while a female university graduate, on average, earned 1.7 times more.
Figure 3: Premiums to tertiary education by sector and gender

Source: Labor Force Survey (LFS) Sri Lanka 2010-2015.
Note: Includes 15-65 year olds. To keep the group of college graduates homogenous, the premium is estimated for those with Bachelor’s degrees only, i.e., we exclude those with post-graduate degrees. Each estimate is the coefficient of a dummy variable indicating whether a person completed college education from a Mincer regression that controls for potential work experience and labor market entry cohort effects. Separate regressions were run for each year, sector and gender combination. The reference educational category is those with completed A levels. The dependent variable is the log of the real hourly wage.
WHY IS THE PRIVATE SECTOR EMPLYING FEW UNIVERSITY GRADUATES BUT PAYING SIGNIFICANT PREMIUMS, WHILE THE PUBLIC SECTOR IS EMPLOYING MANY BUT PAYING LOW PREMIUMS?
Why don’t more university graduates go to the private sector where wages are high, and capture some of these earnings differences? There can be different reasons for this, but here we will focus on one very important reason. The types of university graduates that the private sector needs are quite specific. They are different from those employed by the public sector and different from the majority of graduates produced by the university system. The most common professions for university graduates in the private sector are: managers and production managers (25%), science and engineering professionals (14%), business administration associate professionals (10%), teaching professionals (9%), business and administration professionals (6%), ICT professionals (5%) and science and engineering technicians (5%). The most common professions for university graduates in the public sector are: teaching professionals (45%), business administration associate professionals (18%), clerks (8%), and health professionals (8%) (Figure 4).
Figure 4: Occupational composition of university graduates by sector

Source: Labor Force Survey (LFS) Sri Lanka 2010-2015.
Note: Includes 15-65 year olds. The estimated shares are averages over 6 years. Sorted by share of employees in the private sector. Includes the 17 (out of 38) largest occupations in the private sector. All excluded occupations contribute less than 1% of employment in both the private and the public sector.
WHICH PROFESSIONS ARE MOST LIKELY IN SHORT SUPPLY?
We compare the hourly wages of university graduates in various occupations, regardless of whether public or private sector, to the hourly wages of the teaching professionals (the largest group among university graduates). We control for the level of labor market experience, gender, cohort effects, and for whether one has a post-graduate degree, to ensure that we compare the wages of individuals that are otherwise similar. ICT professionals earn 106% more than teaching professionals; production managers and chief executives earn 33-35% more; engineers earn 25% more; and health professionals and ICT technicians earn 24% more than teaching professionals (Figure 5). Having a post-graduate degree is associated with additional 20% premium. As anticipated, most of the professions with higher returns than the teaching profession are typically employed in the private sector. By paying wages significantly higher than the ones of the typical employee with tertiary education, the private sector is signaling that they need these specific professions and that they may have hard time finding such candidates in the Sri Lankan labor market. In other words, these are the professions/educational fields where an expansion of the tertiary education could most likely help relax a skill shortage constraint. Outside these professions, we find little evidence of educational shortages at the tertiary level.
Figure 5: Occupational premiums among university graduates
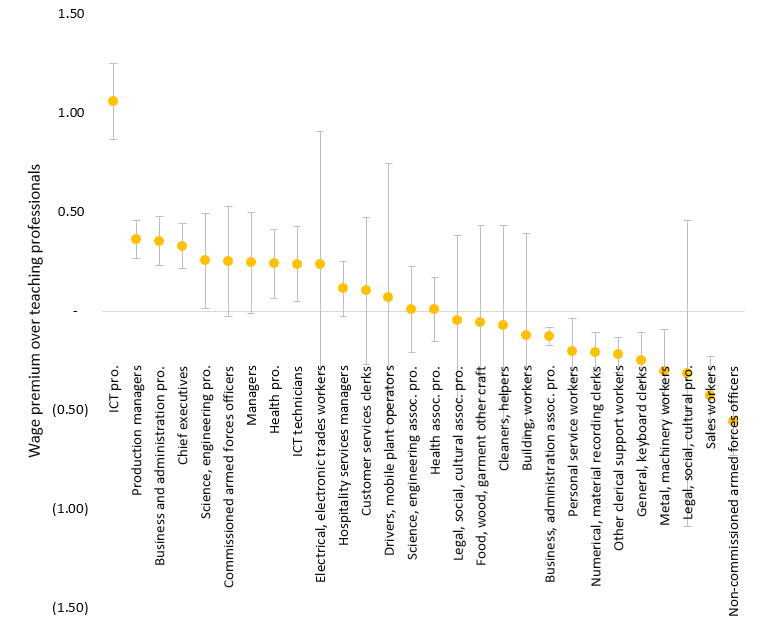
Source: Labor Force Survey (LFS) Sri Lanka 2010-2015.
Note: Includes 15-65 year olds, all sectors, tertiary graduates only. Results from a Mincer-like equation, but with occupational dummies instead of education. Controls include potential labor market experience and its square term, labor market cohort dummies, a gender dummy and a dummy for having a post-graduate degree. The whiskers correspond to the 95% confidence intervals. The dependent variable is the log of the real hourly wage.
CONCLUSIONS AND POLICY DISCUSSION
Using data from the Labor Force Survey of Sri Lanka (2010-2015), we study the claim that skill gaps resulting from the restrictive tertiary education system of Sri Lanka present a serious challenge to the economic competitiveness of Sri Lanka. Theoretically, skill gaps can restrain companies’ choice of employees, both in terms of numbers and quality. There are two straightforward tests that we perform in order to see whether such skill gaps exist. First, we check if college graduates have an easy time finding jobs in Sri Lanka, and second, we measure the returns to their college degrees. We expect that employment rates are high and returns to education are high for degrees that are in short supply. We find that this is the case only with a subset of occupations/educational fields at the university level: ICT professionals and technicians, managers and executives, business and administration professionals, science and engineering professionals, and health professionals. The majority of these are employed in the private sector where, the returns to a college degree are high. However, the private sector only employs 23% of all university graduates, while the public sector (government and semi-government) employ the other 77%. The public sector pays 40% less than the private sector wages paid to university graduates on average. Unless the public sector vastly compensates for this wage differential with more generous fringe benefits and higher job security, we have to conclude that we only find evidence for skill gaps in a fraction of Sri Lanka’s college majors listed above.
The Vision 2025 of the Government of Sri Lanka (GoSL) envisages an expansion of the tertiary education system. Our findings inform that, when doing so, GoSL should focus on the expansion of particular college majors, and not on the general expansion of the higher education system. Increasing the access to ICT, managerial, engineering, business and healthcare professions in particular would benefit the Sri Lankan economy as it will expand the companies’ choice of workers and enable them to grow faster that they can do now.
A question to explore further is whether the scope of this expansion should go beyond the system of higher education, and include the system of vocational training and secondary education. Previous research (Dundar et al. 2017) has shown that the capacity of science and engineering education at the tertiary level is restricted by the low capacity of the secondary education to equip the students with the basics of science, meaning that the expansion of tertiary education in these fields will need to be accompanied by expansion of science education at the secondary level. Moreover, Sri Lanka has a well-developed system of vocational training and it is worthwhile exploring whether the TVET could partially help bridge some of these gaps with strong participation of the private sector that is facing the skill shortages.
Finally, like most developing economies, Sri Lanka faces significant brain drain. Sri Lanka is a net exporter of many professions including engineers and engineering technicians (Growth Lab at CID 2018). Although Sri Lanka pays high wages for engineers relative to other professions in the country, Sri Lanka does not pay internationally competitive wages for their professionals. The salary of a mid-level engineer in Colombo for instance was among the lowest in Asia and Oceania in 2012 (JETRO 2013) – about half of what a mid-level engineer is paid in Beijing and only 16% of what the equivalent engineer is paid in Singapore. However, Sri Lanka does not have a choice but to further expand the supply of shortage professions. Only a supply push can help the existing industry expand and potentially attract further capital investments, including foreign investments in Sri Lanka.