How do you finance the world’s newest nation? A dispatch from Bougainville
By Niklas Piringer, MPA/ID 2026, Harvard Kennedy School, and Growth Lab Research Associate
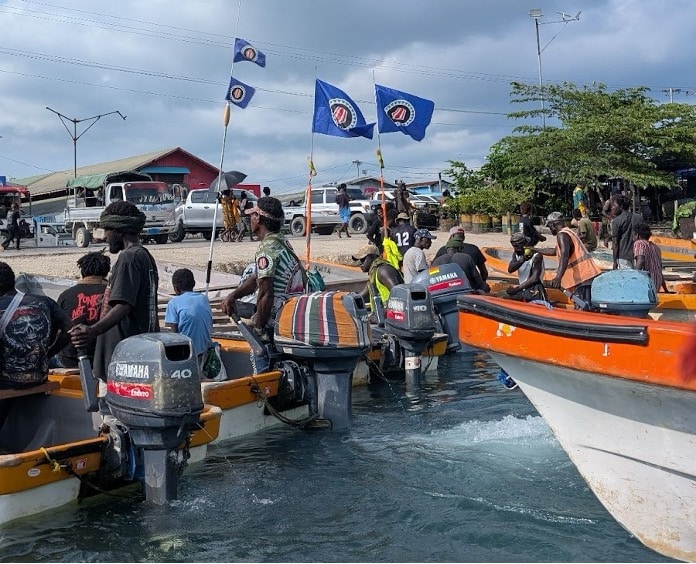
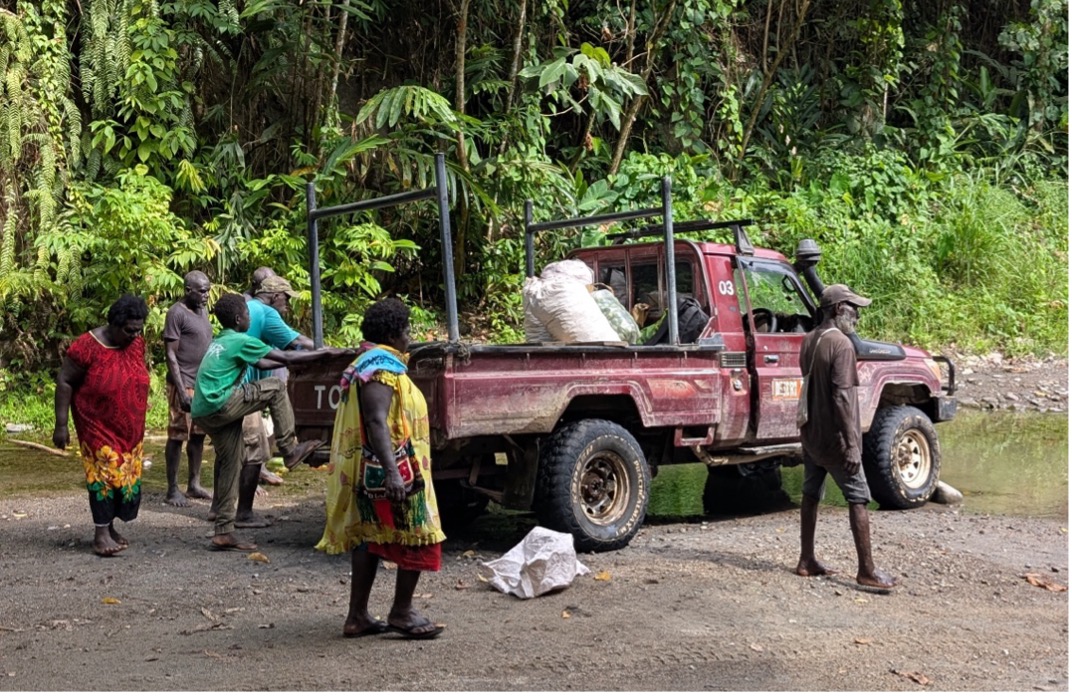
The thrum of outboard motors carries across the water as I board a small boat in the Buka Passage, the narrow strait that separates Bougainville’s main island from its northern tip. Nearly every vessel around me flies the Bougainvillean flag. The national colors of Papua New Guinea are nowhere to be seen. In 2019, 98% of Bougainvilleans voted for independence in a referendum widely regarded as free and fair, one of the most decisive democratic mandates in recent history. The target date for formal sovereignty is September 2027. But voting for a country and financing one are two very different things.
A $400 million challenge
Bougainville is a region of 367,000 people with a GDP of roughly $275 million and a per capita income of around $750. Today, less than 7% of government spending is domestically financed; the rest comes from Papua New Guinea transfers and donor grants. Running a fully sovereign state would cost an estimated $350 to $485 million annually: Bougainville would have to fund its own courts, police, health care, education, foreign affairs, basic infrastructure, and more. My master’s thesis, co-authored with Anna Christina Thorsheim and advised by Professor Ricardo Hausmann, estimates that even under optimistic assumptions about economic growth and improved tax collection, non-mining revenues could cover only 15-25% of what independence requires. Cocoa, fisheries, tuna licensing, and tourism all have potential, but none come close to closing the gap.
There is one source that could substantially close it: the Panguna copper and gold mine, shuttered since 1989, and the source of the conflict that defined a generation.
A mine that built, and broke, a nation
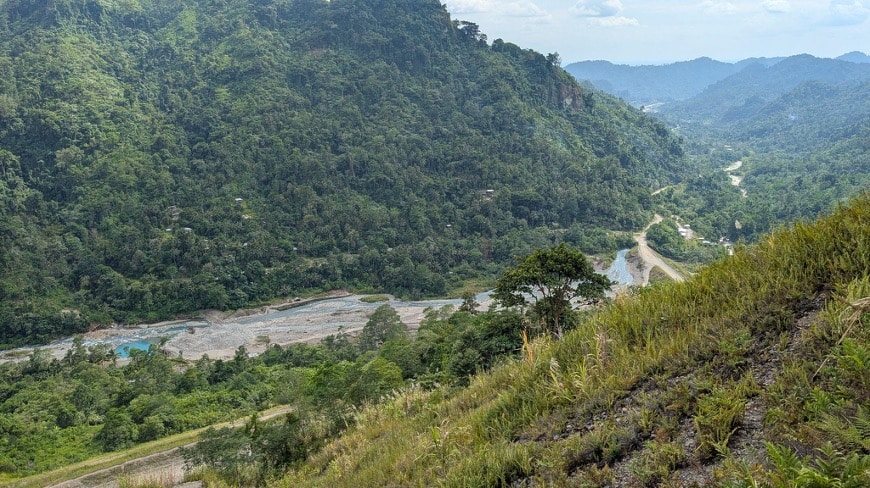
From 1972 to 1989, Panguna was operated by Rio Tinto and accounted for 45% of Papua New Guinea’s exports and 17% of its national tax revenues. But the revenues were largely not shared with Bougainville. Rio Tinto discharged billions of tonnes of waste rock and copper-laced tailings into the Jaba and Kawerong river systems, contaminating waterways that communities depended on for drinking water and fishing. Bougainville’s land is almost entirely under customary ownership, about 98%, yet compensation to landowners was poorly calibrated to this reality, leaving communities bearing severe environmental costs while receiving little in return.
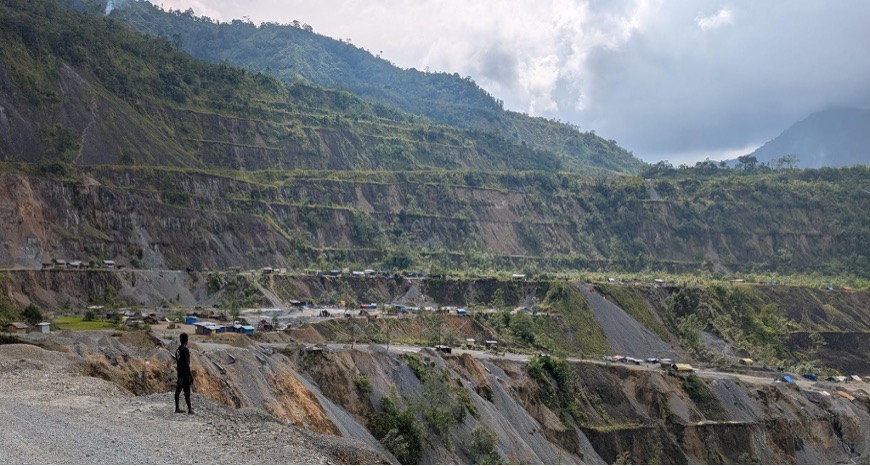
An armed insurrection shut the mine in 1989. The decade-long civil war that followed claimed roughly 15,000 lives – the deadliest conflict in the Pacific since World War II. A 2001 Peace Agreement ended the fighting and established autonomous governance. But Panguna has never reopened. Today, the pit is home to hundreds of informal miners – entire families working without permits, exposed to mercury and heavy metals, surviving in an extralegal economy born of necessity.
The economics of getting it right
Panguna contains an estimated 5 billion tonnes of copper and 19 million ounces of gold – a total mineral valuation of $60-80 billion. But reopening it requires approximately $8.2 billion in upfront capital investment in today’s money, among the highest for any copper mine globally. Bougainville cannot raise this independently and lacks the knowhow to run a major mine. It needs an international mining partner.
This is where project risk becomes decisive. The tax revenues that Bougainville can capture depend directly on how risky investors perceive the project to be. When investors see high risk, they require higher returns to justify the investment, which means a larger share of revenues must flow back to the developer rather than to the government. Our modelling shows that at high risk levels – reflecting Bougainville’s conflict history, regulatory uncertainty, and a civil service of roughly 400 people – a reopening could fail to generate any substantial revenue for the government. The developer would need to retain nearly all cash flows just to service the $8.2 billion investment. A single-grade improvement in country risk, secured with the help of multilateral development bank guarantees or credible arbitration frameworks, could increase government revenues by around $150 million per year.
The policy choices that Bougainville’s government makes in the next few years will therefore shape what the mine is worth to its people for the next two decades.
Niklas Piringer, MPA/ID 2026
The precedent for sound policy exists: when Ghana discovered the Jubilee oil field in 2007, it immediately sought technical assistance – from the World Bank, Norwegian petroleum advisors, and Brazil’s Petrobras – not just to license a developer, but to build the regulatory institutions and negotiating capacity needed to govern the sector in the public interest.
A different kind of mine
What made the original mine politically unsustainable was not mining itself, but who bore its costs and who captured its benefits. Our thesis recommends a joint venture between local Bougainvillean stakeholders and a foreign developer, with landowner equity stakes, environmental remediation costs embedded in capital expenditure from the outset, and transparent revenue-sharing arrangements. Our findings from the ground indicate that this is not merely a financing question, but a prerequisite for political viability. Landowner opposition was the proximate cause of the 1989 conflict. Unified consent is essential before any reopening can succeed.
Even with everything in place, Bougainville’s timeline is unforgiving. Mine construction takes at least four years. Meaningful revenues are unlikely before the early 2030s – meaning Bougainville likely cannot sustain independence for several years after the 2027 independence target. And Bougainville will need unusually high fiscal discipline: a hard annual spending cap and a sovereign savings mechanism to ensure that when revenues arrive, they build a durable state rather than fuel a short-term boom.
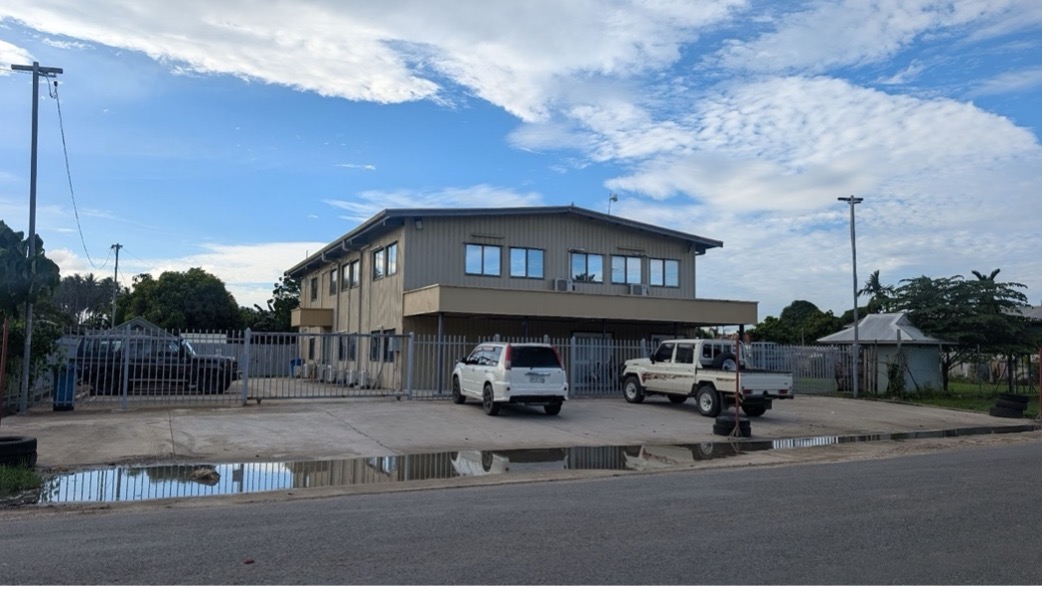
On my last afternoon in Buka, I passed the Department of Treasury and Finance – a modest two-story building, no larger than a suburban house. It is difficult to picture the team inside overseeing the fiscal architecture of a newly sovereign state: negotiating a mining contract worth billions, designing a wealth fund, and managing relationships with international creditors. But things can change remarkably quickly in this sleepy town. After all, thirty years ago, this island was a blockaded war zone. Bougainville’s flags are flying. The rest is yet unknown.
From Chips to Beyond: Taiwan’s Need for Economic Diversification
By Rachel Chang
The fate of Taiwan’s economy hangs in the balance as the semiconductor industry encounters mounting geopolitical pressures from the United States and China. Although Taiwan’s dominance in the chip market provides a short-term advantage, it also exposes the economy to vulnerabilities. Taiwan must diversify into other industries in order to achieve a more stable path of growth and development and protect itself against the fluctuations of the chips industry.
Taiwan’s rise to dominate the IC industry
Taiwan is the leading producer of digital monolithic integrated circuits (ICs), exporting $164B annually or 23% of the entire world’s export supply. ICs, also known as microchips or chips, are the essential component of any electronic device, from smartphones to washing machines to cars and fighter jets, and powers the world’s digital infrastructure.
Figure 1: Electronic Integrated circuit (ICs) Exports by Country, 2020
(Source: Atlas of Complexity)
As China and many other countries attempt to close the gap in the global chip race, Taiwan remains home to more than 90% of the manufacturing capacity for the world’s advanced ICs.
The root of Taiwan’s chip manufacturing success can be traced back to the founding of the Industrial Technology Research Institute (ITRI), a government-supported nonprofit with the goal of promoting industrial technology development, in the 1960s. The institute worked with foreign partners to acquire IC technology and fund the incubation of the world’s top semiconductor foundries today: Taiwan Semiconductor Manufacturing Company (TSMC) and United Microelectronics Corporation (UMC).
Given budgetary constraints, TSMC and UMC operated fabrication plants that produced ICs for other companies, instead of designing its own products. This low-cost model, also known as the pureplay foundry model, began the interdependence of these Taiwanese IC suppliers and their international customers. It created specific knowledge areas in the IC and semiconductor industries, grew IC exports and drove Taiwan’s economic development.
Figure 2: Gross chip exports over time (left), Share of world’s chip exports (right)
(Source: Atlas of Complexity)
Why Taiwan’s stronghold in chip manufacturing is risky
Today, ICs comprise 41.5% of all Taiwanese exports and 25% of GDP. This dependence has made Taiwan’s economy susceptible to a number of recent economic and political shifts, including China’s increased military exercises and TSMC production moves to the United States.
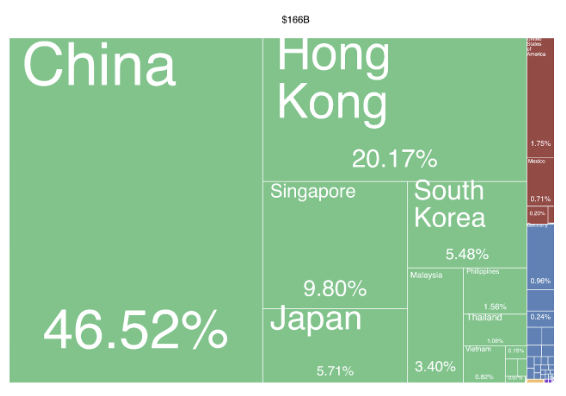
In October 2022, the Biden administration imposed a sweeping set of controls on the sale of advanced chips and chip-making equipment to Chinese firms. Given that 46% of Taiwanese IC exports go to China, the controls caused disruptions in the supply chain and resulted in reduced demand from Taiwan. China is also one of Taiwan’s biggest customers, importing 38% of ICs from Taiwan, further highlighting the dependence of Taiwan’s economy on Chinese markets.
Figure 3: Taiwan’s IC Exports, 2020
(Source: Atlas of Complexity)
Figure 4: China’s IC Imports, 2020
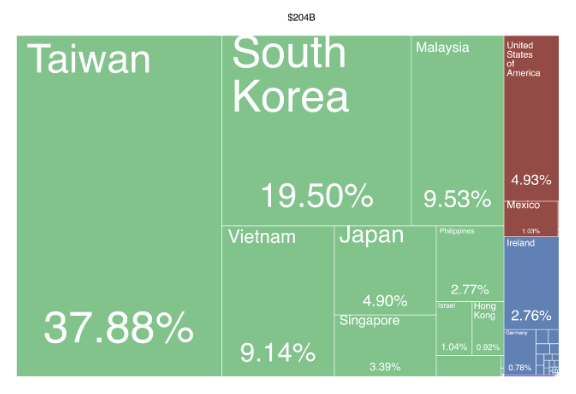
(Source: Atlas of Complexity)
With TSMC making up one-third of the value of the Taiwanese stock market and taking in about 10% of its revenue from China-based customers, TSMC shares fell 8.3% to its lowest close in more than two years.
Moreover, the growing semiconductor chip race between the United States, Europe, and Asia have made the future of Taiwan’s semiconductor chip production unpredictable. Each economy or regional block attempts to control the semiconductor production and not overly rely on the other for vital technology and materials.
What is Taiwan’s diversification story?
As these risks intensify, the question of diversification for Taiwan is less straightforward. Taiwan has reached the forefront of technology by producing and exploiting nearly all of the major products currently available. IC and semiconductor production, along with other electronics and machinery products have played a significant role in making Taiwan’s economy highly complex.
Taking a closer look at Taiwan’s Feasible Opportunities, we identify several potential products that are “closer” in distance and have relatively high complexity and could serve as potential candidates for economic diversification.
Figure 5: Taiwan’s Feasible Opportunities Graph Highlighting Several Products
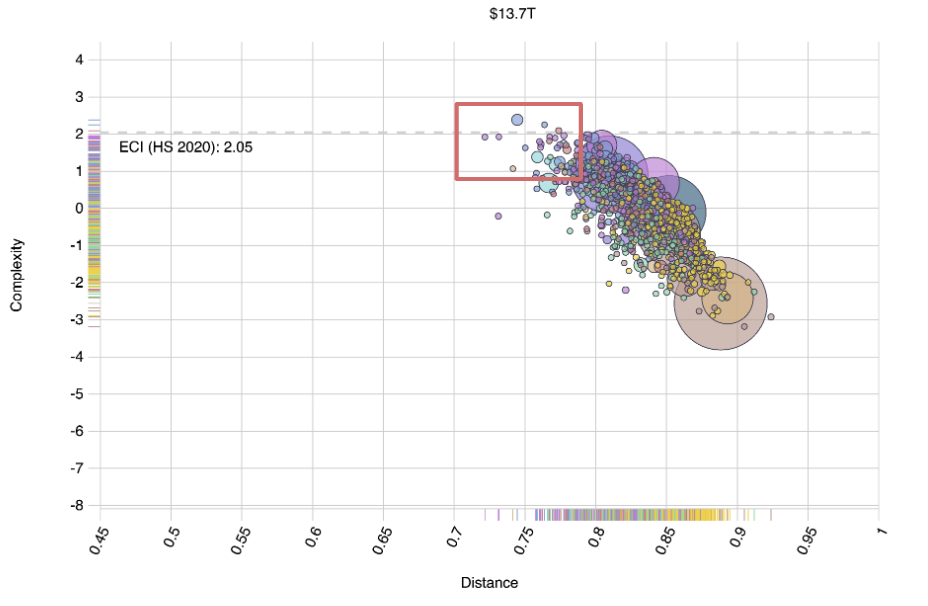
(Source: Atlas of Complexity)
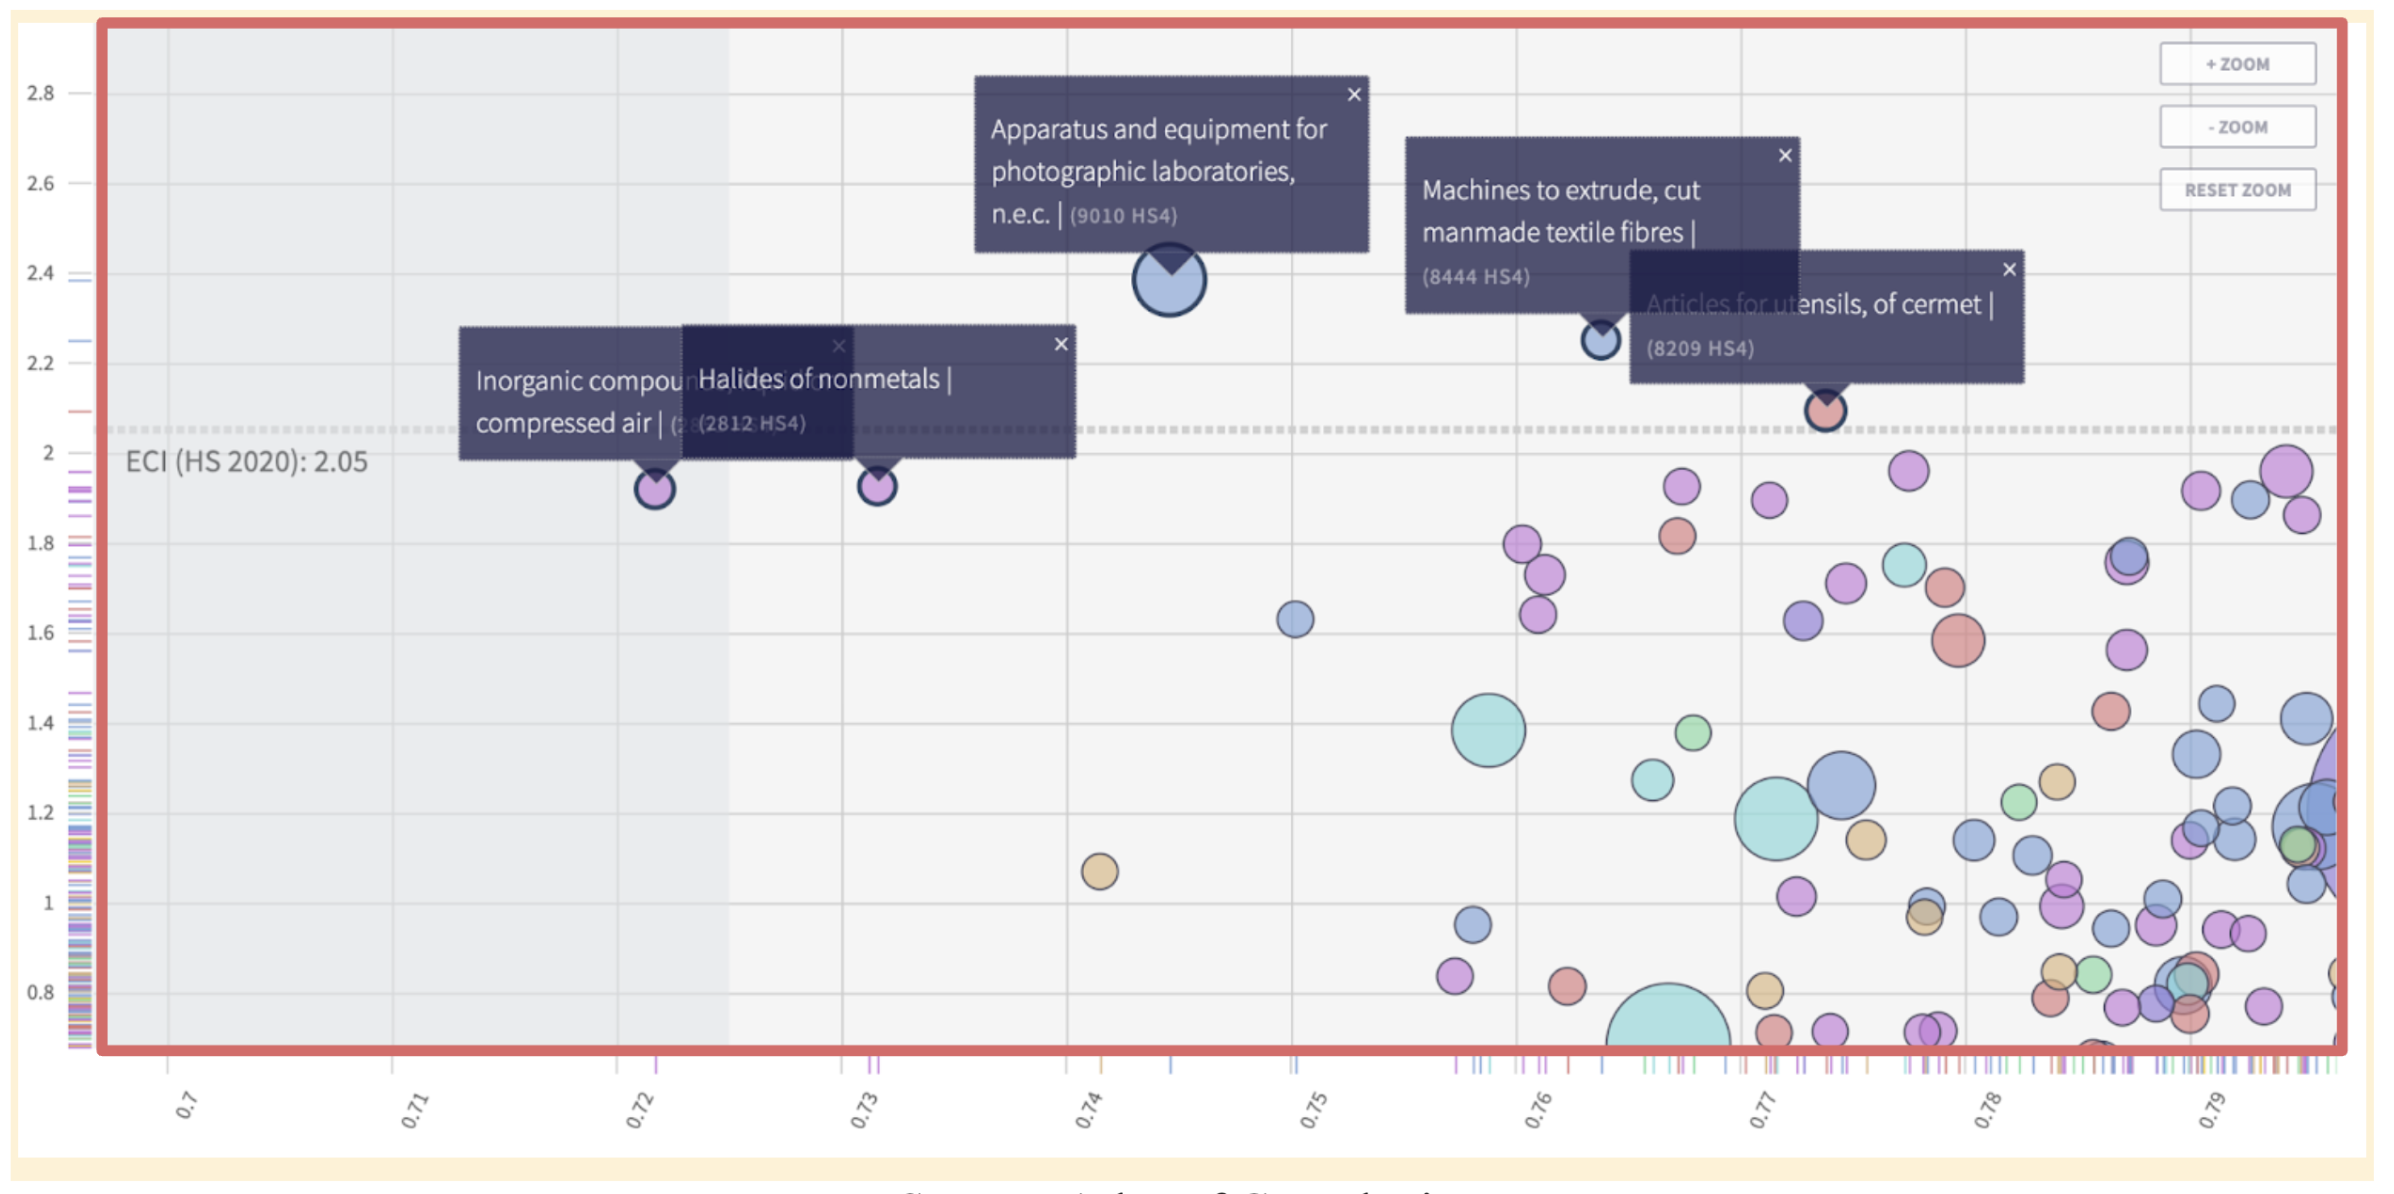
Apparatus and equipment for photographic laboratories could be promising new entrants for Hsinchu, Tainan and Zhuanghua City. This industry is a better technological fit to these cities than that of their selected peer groups. Photographic equipment and supplies merchant wholesalers also presents an opportunity in Hsinchu and Kaohsiung’s trade and transportation sectors.
Figure 6: Kaoshiung Feasible Opportunities
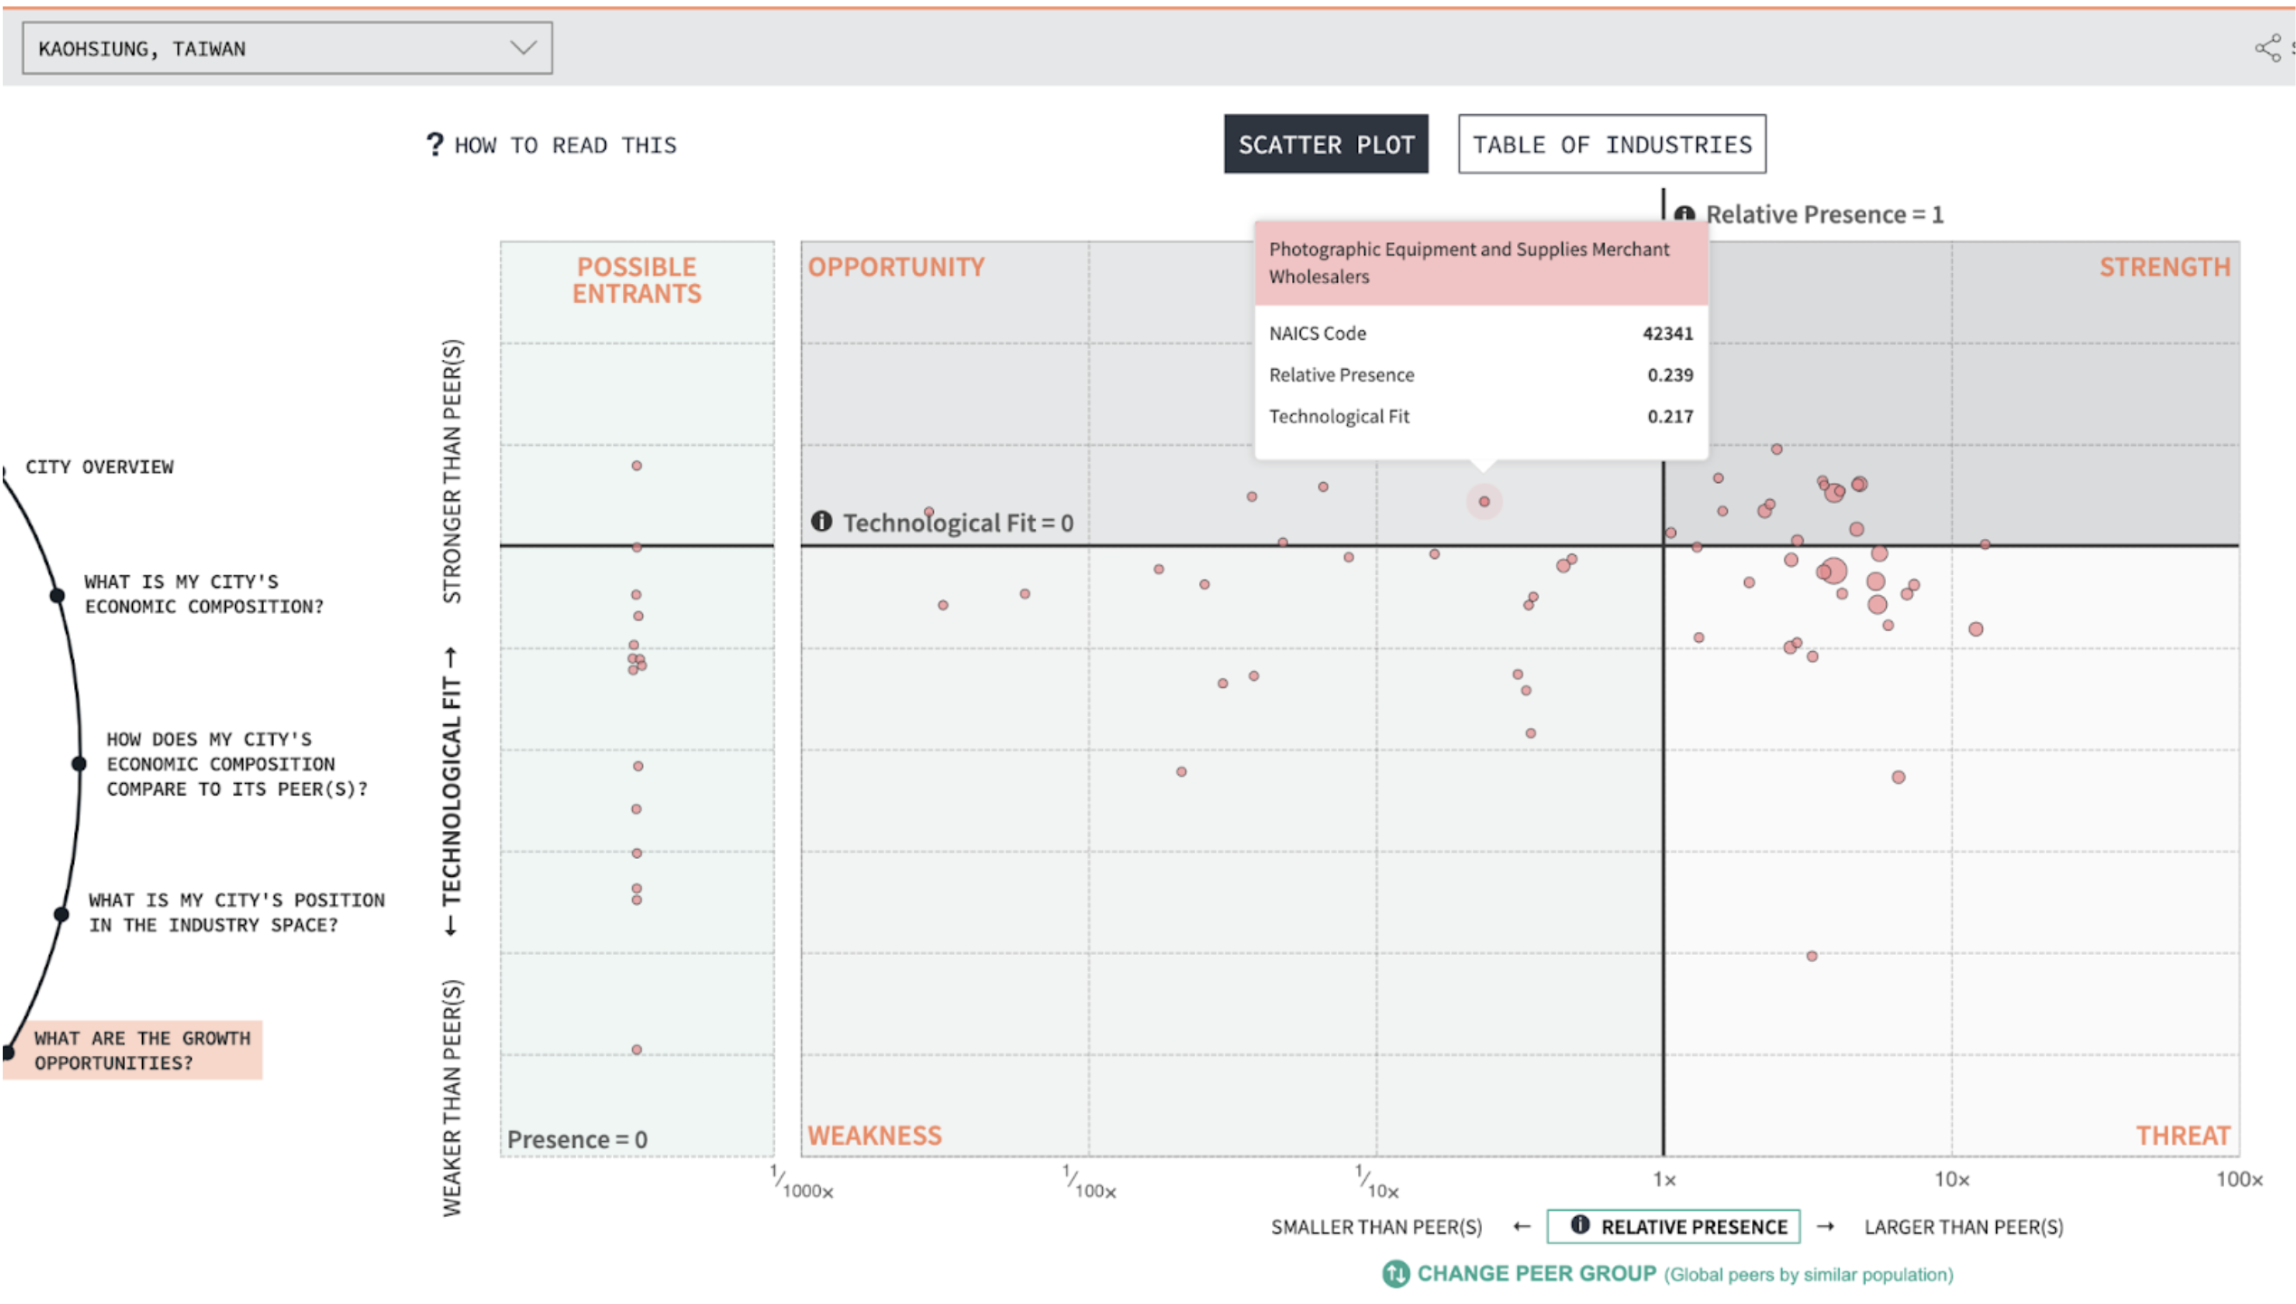
(Source: Metroverse)
Chemical manufacturing is also an opportunity in the New Taipei Metropolitan Area, which aligns well with Taiwan’s suggested export opportunities in halides of nonmetals, inorganic compounds, and petroleum resins as indicated by Taiwan’s Feasible Opportunity graph.
Figure 7: New Taipei Metropolitan Area Feasible Opportunities
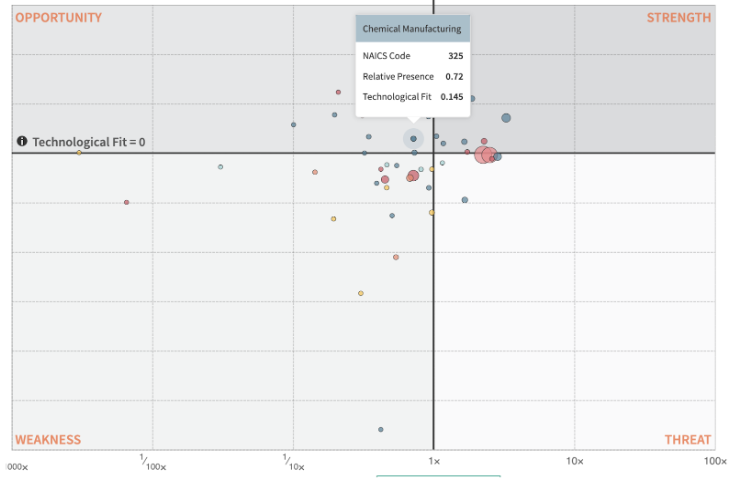
(Source: Metroverse)
However, when we look at potential products Taiwan could export overall in Figure 5, most of the opportunities are “far” away from Taiwan’s current capabilities, given the large minimum distances from Taiwan’s Economic Complexity Index (ECI) line, or the measure of how diversified and complex Taiwan’s total export basket is. It may take a few strategic jumps for Taiwan to diversify into these new products. The bulk of these feasible products are low in complexity, which may not be favorable to a highly complex economy. Therefore, diversification for Taiwan may mean promoting innovation and inventing new products.
Can a better story of diversification be illustrated at the city level?
Metroverse makes visible what a city is good at today to help understand what it can become tomorrow. Analyzing Taiwan’s diversification prospects at the city level yields a clearer picture of which industries have the highest potential based on the city.
The Telecommunications, Apparel Manufacturing, and Printing and Related Support Activities industries provide economic opportunities in most cities. Nonetheless, each city should focus on different specializations and pursue distinct diversification strategies. National policies could assist, but city-specific policies may have a more significant impact.
Figure 8: “Opportunity” Industries based on City

(Source: Metroverse)
A case study for opportunities in the medical industry
Hsinchu, Kaohsiung, Taichung, Tainan, Taipei Metropolitan Area, and Zhuanghua are six major cities in Taiwan that have opportunities in either the Pharmaceutical/Medicine Manufacturing or the Medical Equipment/Supplies Manufacturing industries. As it turns out, these cities also have existing strengths in the semiconductor, IC, and electronic component manufacturing industries.
Figure 9: Growth Opportunities in Pharmaceutical Manufacturing (Top), Medical Equipment and Supplies Manufacturing (Middle), Semiconductor and other Electronic Component Manufacturing (Bottom)
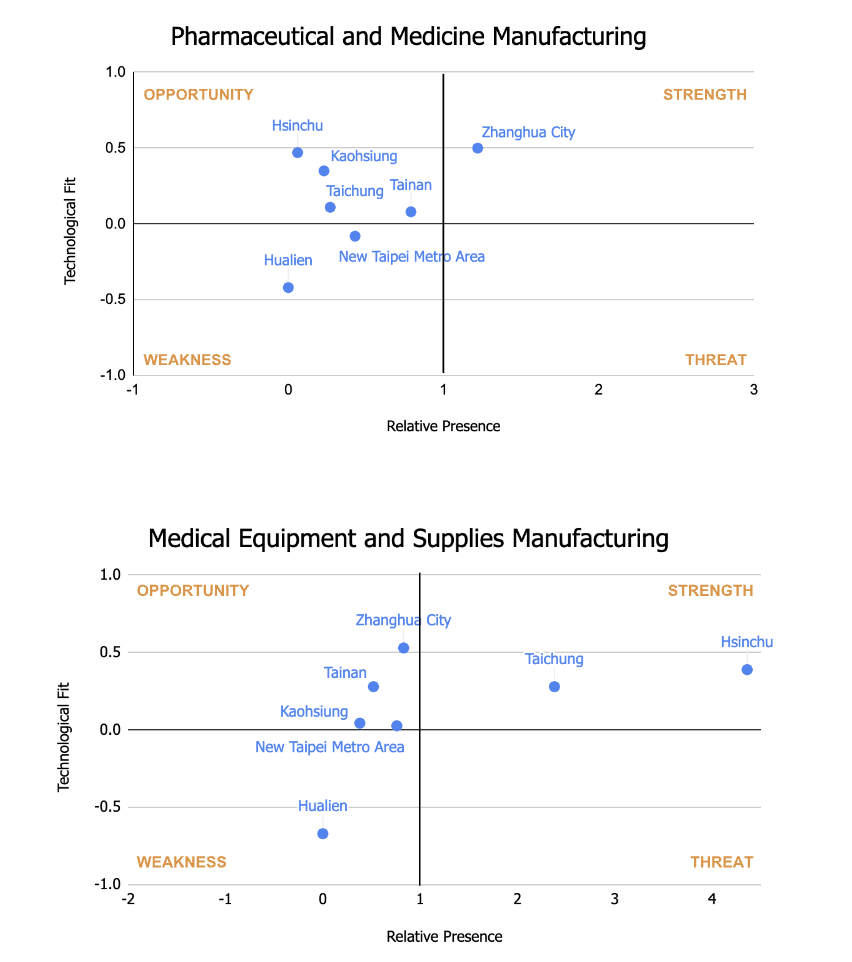

(Source: Metroverse)
The potential for growth in the Pharmaceutical/Medicine Manufacturing and Medical Equipment/Supplies Manufacturing industries reflects Taiwan’s strategic goal of positioning itself as a worldwide hub for pioneering research and development in the fields of biomedical and life sciences. The government’s 2018 “5+2 Industrial Innovation Plan” indicates that biotechnology is one of seven key high-tech initiatives that will “serve as the central driver of Taiwan’s industrial growth into the next era.”
Taiwan has established biotechnology research parks in several cities, equipped with laboratory facilities, office space, and business development services, to support companies in the biotech and medtech sectors. The government has also streamlined market approval and R&D reimbursement timelines and made it easier for small companies to go public. As a result, the total market capitalization of local biotech companies has increased 700% since 2008, and patent data suggests a 1.9% year-on-year increase in biotech innovation.
Figure 11: Number of Patents in the Biotechnology Sector
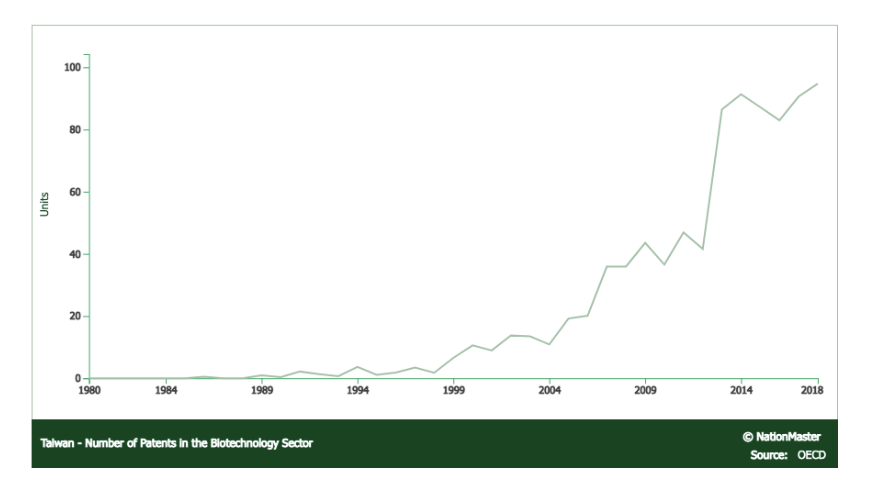
(Source: OECD)
Looking forward
To lessen its dependence on the semiconductor industry and diversify its economy, Taiwan should explore further opportunities in industries, such as Telecommunications, Apparel Manufacturing, and Printing and Related Support Activities. These industries offer growth opportunities across several major cities.
In particular, the Telecommunications industry has great potential, and its three major providers, Chunghwa, Taiwan Mobile, and FarEasTon, could significantly contribute to this progress. They can do this by extending their 5G services, creating inventive IoT applications in areas such as smart homes, smart cities, and healthcare, emphasizing cybersecurity, promoting public-private partnerships, and investing in talent development.
Some experts suggest that Taiwan should broaden the geographic scope of TSMC’s operations and the semiconductor fabrication industry to other locations as part of its diversification strategy. However, this may not necessarily safeguard Taiwan’s economy. Therefore, apart from supporting broader national initiatives, Taiwan should consider implementing more targeted policies to cater to the unique needs and opportunities of each city’s industry growth potential.
Setting the Grounds to Measure Smallholder Farmers’ Complexity
By Laura Romero
The Growth Lab has estimated economic complexity, a measure of knowhow agglomeration, for several countries worldwide. However, measuring complexity in the agricultural sector poses a significant challenge. What is more, measuring it for smallholder farmers around the world is even more complex. Through our work, we have laid the groundwork for future measures of complexity for this population.
I joined the Growth Lab Agriculture Initiative last October, aware of how challenging it would be to answer this question. We started with the basics: Who are the small farmers? If you ask someone in India and someone in Albania, I assure you that the answers will diverge. In fact, the literature recognizes that smallholder farmers are a heterogeneous group (Ethical Trading Initiative, 2005; FAO, 2012). Some of the variables in which they differ include the following:

Typically, smallholder farmers produce relatively modest volumes of goods on small plots of land. They are generally less well-resourced, vulnerable in supply chains, and have limited access to markets and services. The most common criteria used to define smallholder farmers globally is land size, with a consensus that they work on land plots smaller than 2 hectares (Committee on World Food Security, 2016; FAO, 2012).
With this in mind, we explored worldwide data on these population. The most comprehensive datasets are published on the FAOSTAT statistics website, which contains information for over 145 countries. Relevant databases include Structural Data From Agricultural Census and Production Crops and Livestock Products (FAO, n.d.). By calculating comparative advantage indicators to get information on the productive capabilities, we determined that some countries have comparatively more smallholder farmers than others. These countries include Guatemala, Albania, Lebanon, Jordan, Egypt, Namibia, and India, among others.
Furthermore, using a programming function, we were able to determine the revealed comparative advantage (RCA) by crop and country for three time periods: 1990, 2000, and 2010. We also estimated which crops were the top five produced by each country and analyze whether these had comparative advantages with respect to the region.
Since worldwide information about country and hectares harvested for each crop is not available by land size, the next step was to compare the top five most produced crops by country and its RCAs with national information. For a subset of six countries, we analyzed which crops were most commonly harvested by smallholder farmers, using Agricultural Censuses of National Surveys. The countries are Guatemala, Colombia, Albania, Ethiopia, Namibia, and South Africa.
Guatemala and Albania stand out as countries with relatively more smallholder farmers’ land with respect to their respective regions, as well as to the set of developing countries in the world. In the case of Guatemala, coffee, sugar crops and maize are three out of the five most produced to display a comparative advantage with respect to Latin America. According to the country’s national survey, coffee and maize are among the most harvested crops by smallholder farmers (Instituto Nacional de Estadistica [INE], 2013). In the case of Albania, there are comparative advantages for cereals, pulses, and wheat, all produced by smallholder farmers (Institute of Statistics [INSTAT], 1998).
Colombia also has relatively more smallholder farmers’ lands compared to the other countries in the continent. Coffee, fruit, and rice are some of the most harvested crops in the country, with comparative advantages over other crops. From these, coffee, banana, and plantain are the most frequently harvested crops by small farmers (Departamento Administrativo Nacional de Estadistica [DANE], 2014).
Top 5 crops produced by country: Share and RCA – 2000

In Africa, Ethiopia and Namibia are highlighted as countries that have relatively more smallholder farmers’ land concerning their respective regions, as well as the set of developing countries in the world. In Ethiopia, cereal crops and wheat are two of the most produced to show a comparative advantage. According to the country’s Agricultural Census, cereals like teff, sorghum, barley, and wheat are among the most harvested crops by smallholder farmers (Central Statistical Agency [CSA], 2012). In the case of Namibia, there are comparative advantages for edible roots, cereals, and specifically millet. Indeed, millet is one of the most commonly harvested crops by smallholder farmers, along with sorghum (Ministry of Agriculture, Water and Rural Development [MAWRD], 1995).
Finally, South Africa stands out from other African and developing countries due to its relative lack of smallholder farmers’ lands. The countries’ top five harvested crops have a comparative advantage compared to the region. There are sunflower seeds, wheat, sugar cane, cereals, and maize. From these, smallholder farmers produce maize and sugar cane (Statistics South Africa, 1997).
Top 5 crops produced by country: Share and RCA – 2000
There have already been initiatives aimed at prioritizing specific products for smallholder farmers to integrate into local and global markets. One example is Japan’s One Village, One Product program, which was developed in 1979 to increase the value of locally produced goods and boost household and national income. The program targeted farmer groups and cooperatives, with one village sometimes prioritized. This public policy has been replicated in several countries (FAO, 2013).
More recently, the FAO launched the One Country Priority Product (OCOP) initiative to promote special agricultural products with unique qualities and characteristics. This project places smallholders and family farming at the center of interventions to improve access to stable markets and serve as a key entry point for achieving their defined priorities (FAO, 2022). Numerous countries have already defined which products to prioritize, taking comparative advantages into consideration. From the countries we analyzed, Guatemala prioritized coffee and Ethiopia prioritized teff.
Overall, we have laid the groundwork for future measures of complexity for smallholder farmers around the world. We have developed a methodology that uses comparative advantages to identify existing capabilities in different economies. We identified who the smallholder farmers are, where their lands are predominantly located, which crops are most harvested, and whether they display comparative advantages. Additionally, we have presented some initiatives that propose the prioritization of certain products to integrate smallholder farmers into local and global markets. Mapping the existing capabilities of different types of farmers and crops that diverge in productivity is a crucial first step in discussing economic complexity in smallholder farmers.
References
Central Statistical Agency. (2012). Statistical report on the 2010-2011 agricultural sample survey. Volume I: Statistical report on crops (private peasant holdings). Addis Ababa, Ethiopia. Retrieved from https://catalog.ihsn.org/catalog/1389/related-materials
Committee on World Food Security. (2016). Connecting smallholders to markets. Food and Agriculture Organization of the United Nations. Retrieved from https://www.fao.org/3/bq853e/bq853e.pdf
Departamento Administrativo Nacional de Estadística. (2014). Censo Nacional Agropecuario 2014: Resultados nacionales. Retrieved from https://www.dane.gov.co/files/images/foros/foro-de-entrega-de-resultados-y-cierre-3-censo-nacional-agropecuario/CNATomo2-Resultados.pdf
Ethical Trading Initiative. (2005). Recommendations for Working with Smallholders. Retrieved from https://www.ethicaltrade.org/sites/default/files/shared_resources/eti_smallholder_guidelines_english.pdf
FAO. (2012). Coping with the food and agriculture challenge: smallholders’ agenda. Retrieved from https://www.fao.org/fileadmin/templates/nr/sustainability_pathways/docs/Coping_with_food_and_agriculture_challenge__Smallholder_s_agenda_Final.pdf
FAO. (2013). Global application of the One Village One Product Movement concept: Lessons from the experiences of the Japan International Cooperation Agency. Rome, Italy: FAO. Retrieved from http://www.fao.org/3/a-i3251e.pdf
FAO. (2022). The Global Action on Green Development of Special Agricultural Products: One Country One Priority Product Action Plan 2021-2025. Retrieved from http://www.fao.org/3/cb5506en/cb5506en.pdf
FAO. (n.d.). FAOSTAT. Retrieved March 23, 2023, from https://www.fao.org/faostat/en/#data
Institute of Statistics. (1998). Albania – Agricultural Census 1998 – Main Results. Retrieved from https://www.fao.org/fileadmin/templates/ess/documents/world_census_of_agriculture/main_results_by_country/albania_2000.pdf
Instituto Nacional de Estadística. (2013). Guatemala – Encuesta Nacional Agropecuaria 2013. https://www.ine.gob.gt/encuesta-nacional-agropecuaria/
Ministry of Agriculture, Water and Rural Development. (1995). Namibia Agricultural Census 1995 – Main Results. Retrieved from https://www.fao.org/publications/card/es/c/8dc4e39c-6b78-4ddf-889c-180389c24900/
Statistics South Africa. (1997). South Africa Rural Survey 1997. Retrieved from https://microdata.worldbank.org/index.php/catalog/1602
‘Aha’ moments: On the ground in Kazakhstan with the private sector
Kazakhstan is one of the least densely populated countries in the world. It has an area roughly equal to that of all of Western Europe and a population of 19 million – around that of the Netherlands. Kazakhstan became Independent in 1991 after the fall of the Soviet Union and shortly thereafter experienced an oil boom. The global commodity super-cycle ended in 2014, and oil prices fell. Kazakhstan’s unique socioeconomic history and its vulnerability to commodity price shocks have led to three interrelated development challenges. The country’s large size and low population density mean it is a remote place, and economic innovation and productivity growth are impeded by the difficulty in agglomerating people in major urban centers. The dominance of oil in its export basket puts Kazakhstan at risk of the consequences of Dutch disease and resource-dependent growth. Finally, its history as a former Soviet-state leaves Kazakhstan with domestic macroeconomic imbalances and a loss of productive capacities as a result of the centrally planned economy of the Soviet Union.
Kazakhstan was able to achieve an impressive growth episode between 2000-2020, more than doubling its GDP per capita. This strong growth witnessed in the early and mid-2000s was fueled by the country’s hydrocarbon resources, structural reforms, and high Foreign Direct Investments (FDI). However, the fall in oil prices starting in 2014, the lack of economic diversification into non-oil tradables despite ample policy support, and recent geopolitical challenges have put the sustainability of growth in jeopardy.
The Growth Lab is currently engaged with the Government of Kazakhstan to help decision-makers promote sustained long-term growth and inform investment policy design. The research collaboration involves analyzing the country’s productive structure, identifying binding constraints to growth, and providing support for policy formulation and implementation with the aim of initiating sustainable and inclusive growth.
My internship with the Growth lab coincided with analyses that aimed to link growth diagnostics with policy recommendations. My internship, therefore, had three objectives. First, to dig deeper into some of the puzzles identified in constraints analysis. One of these puzzles I focused on was stagnant corporate growth despite generous policy support. The second objective was to formulate policy recommendations to ease the binding constraints identified in the areas of macroeconomics and finance. The third objective was to discuss the team’s diagnostics findings and policy recommendations with stakeholders on the ground in Kazakhstan.
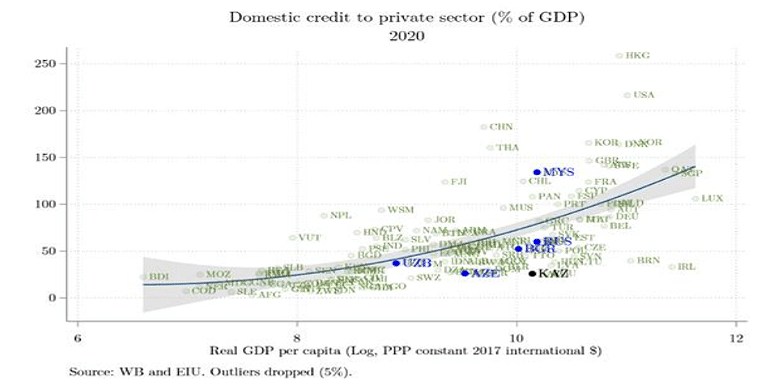
My first few weeks of the internship were based at the Harvard Kennedy School, where I worked on assessing whether access to finance was a constraint to investments and growth in Kazakhstan. Kazakhstan has a stable deposit-to-GDP ratio but a declining private-credit-to-GDP ratio. Recognizing the role of access to finance in investment promotion, the government has implemented several credit initiatives to boost corporate credit, including subsidized lending, credit guarantees, and direct lending. However, corporate credit growth remained dampened despite policy support (Figure 1).
Figure 1.

In its diagnostic framework, the Growth Lab assesses whether access to finance is an obstacle to growth for many reasons. Constrained access to finance can reduce the potential for innovation by forcing companies to forgo investment opportunities and affecting companies’ survival and growth by contributing to working capital constraints. It might also reflect perceptions about the appropriability of returns on innovation and investment. Low corporate credit growth can be a result of supply constraints, demand constraints, or a mix of both. Supply constraints can result from a high price of credit, tight lending conditions, or poor intermediation that fails to allocate available capital to the most promising investment. On the other hand, demand-side constraints can be attributable to most of the branches in the Growth Lab diagnostic tree, including low social return on investments, low skills, and an unfair competition landscape. Thus, my analysis focused on assessing whether there are obstacles to access to finance and whether these obstacles result from supply-side constraints.
The analysis I did while in Cambridge enabled me to understand aggregate trends about credit growth in Kazakhstan and the aggregate scope and size of credit support policies. We learned that Kazakhstan’s private-credit-to GDP is well below the expected levels in its income group (Figure 2). We also found that while interest rates are slightly above average for its income group, collateral requirements are well above the average for Kazakhstan’s income group. This analysis helped us map potential constraints that affect almost all borrowers in Kazakhstan. We were also able to map these constraints to the available credit support policies to triangulate that while high interest rates were targeted with subsidized lending, high collateral constraints represented a blind spot in current support policies.
Figure 2.
I then began to analyze the size of the different credit support measures and found that most of the support goes into interest rate subsidies, which aims to decrease the cost of lending for firms. However, support aimed at mitigating the high collateral requirement was limited in comparison.
Building upon the framework taught to us in the MPA/ID program at HKS, the Growth Lab’s “holy trinity” for sound policy design relies on policies that are technically correct, administratively feasible, and politically supportable. It made technical sense to consider a policy shift from interest rate subsidies to credit guarantees, based on the signals we observed of high collateral requirements. However, we then tested the administrative feasibility of our policy proposal. To assess the administrative feasibility for expanding support to mitigate the collateral requirement constraint, I estimated the fiscal cost of interest rate subsidies and credit guarantees, assuming different scenarios for credit growth.
I then traveled to Nur-Sultan, Kazakhstan’s capital, where I stayed and worked for a month to test our findings and policy ideas with businesses in different sectors. My trip to Kazakhstan gave me many “Aha” moments as it provided me with hands-on conceptualizations of the importance of many of the concepts we covered during my first year in the MPA/ID. Professor Dani Rodrik’s class taught us, among many things, the importance of establishing channels of communication with the private sector that are governed by an institutional framework to keep the private sector at arm’s length. We discussed how this institutional framework should aim to keep the private sector close enough to provide feedback on implementation and insights on constraints, but also far enough to avoid risks of corruption and favoring certain businesses over others.
The opportunity to discuss issues such as low corporate credit growth and less-than-optimal investments with businesses on the ground provided me with insights on bottlenecks in the implementation of credit support policies and exporters’ support policies that I otherwise would have missed if I solely relied on quantitative analysis. Another “Aha” moment was seeing first-hand the heterogeneity of constraints and bottlenecks faced by businesses depending on their sector, size, level of innovation, and age. This heterogeneously is easy to miss when relying purely on quantitative desk research.
While I was aware of the unique insights I obtained during my time in Astana, I was also aware of the potential selection bias because I met with a small sample size of firms. I also knew that they might be telling me one thing but acting out other behaviors in reality. These were risks I knew going into the interviews, but nevertheless, the experience helped me reflect on common criticism towards the international development field due to the limited face time development practitioners have with local stakeholders and their limited and distant understanding of the context. We often tend to overlook that, in the absence of direct and frequent communication channels, even local bureaucrats and government officials have limited face time with businesses and beneficiaries of their policies. With low data availability in many developing countries, qualitative data from interactions with policy beneficiaries is even more crucial for policy design and implementation.
As I start my second year of the MPA/ID and prepare to rejoin the policymaking field after graduation, the lessons learned during my Growth Lab internship on the role of comparative statistics in diagnostics, diagnostic methodology of identifying constraints, and role of qualitative data in policy design and assessment are an essential addition to my Kennedy school experience.
Reflections on Decarbonization: Wyoming vs. Japan
This summer, as a Growth Lab intern, I conducted research on decarbonization in the United States. To gain a better understanding of this topic, I worked with an economist at the Center for Business and Economic Analysis (CBEA) at the University of Wyoming in Laramie. CBEA’s primary task is to work with other departments and state agencies to conduct economic assessments of industrial projects in Wyoming. Most recently, the University of Wyoming received funding from the U.S. Department of Energy for research focused on the use of coal to produce carbon ore, rare earth, and critical minerals1, and CBEA is studying this and other ‘technologies’ potential impacts on local industry. The University of Wyoming, as the ‘state’s only four-year university, provides critical research on economic and energy issues in Wyoming. Through my internship, I was able to deepen my understanding of Wyoming and U.S. energy policy.
The stay in Laramie was a fresh and valuable experience for me. What was particularly impressive to me was the strong attachment of the Wyomingites to nature. Here, nature means both natural resources and the landscape. In town, you can hear the sound of long freight trains carrying coal and other materials passing by regularly, reminding us that this is a resource-producing state. Also, just outside the city, great plains and mountains spread out, and people can easily enjoy hiking and fishing. In addition, every July, the city hosts a large rodeo festival, which is one of the liveliest events of the year. The locals living in this environment have a very strong sense of pride in nature, and it is completely different from that of Boston.
The global trend toward decarbonization, which has accelerated in recent years, may force a change in this identity. However, it is clear that overly simple strategies, such as replacing the shrinking coal industry with an increasing renewable energy, do not fully capture the complexities of economic geography and public opinion in Wyoming. According to a survey conducted by the University of Wyoming2, a high percentage of Wyomingites do not have strong resistance to new technologies such as small nuclear and renewable energy, but they do believe that they can be compatible with the old resource economy, including coal. Given that ‘residents’ views are reflected in policy through elections, local public opinion is as important a factor as economic rationality. This firsthand sense of local realities is what was meaningful I gained during my stay in Wyoming.
 The CBEA at the University of Wyoming conducts economic and business analytics. It also collaborates with other departments, such as the School of Energy Resources. |
 Adjacent to the downtown area, a freight railroad that carries coal and other materials runs day and night. |
 Wyoming’s beautiful nature. For many locals, the outdoors is a part of their everyday life. |
 Rodeo festival held once a year in Laramie. During this week, the downtown area is crowded with people enjoying the food stalls and mobile amusement park. |
Lessons from the comparison of the industrial structure of Japan and the U.S.
What I have realized during the internship is the importance of considering both the common challenge of decarbonization and the differences in the political and economic structures of different countries. In the following, I will introduce some of the topics I worked on, including a comparison of the industrial structure of Japan and the U.S. from the perspective of decarbonization.
A major difference in the industrial structure between Japan and the U.S. is that the share of value added by the manufacturing industry in Japan is nearly twice that of the U.S. (Figure 1). While the share of service industries has gradually increased in Japan, the share of manufacturing has not changed significantly over the last 50 years. This relationship is also true in terms of the number of employees (Figure 2). The importance of the manufacturing sector to the Japanese economy is similar at the regional level. In Japan, where natural resources are scarce, the degree of the development of the manufacturing sector has been closely related to the development of each region (Figure 3). In the U.S., on the other hand, no such correlation exists. This indicates the existence of a variety of economic structures, such as states with a high share of service industries, such as California, and states with abundant natural resources, such as Wyoming. These differences in economic structure suggest that decarbonization is an urgent issue for Japan because it has a high proportion of energy-intensive sectors, such as heavy industry. However, it also highlights an urgent problem for U.S. states like Wyoming that have achieved a high standard of living based on an economic structure that will be unable to support the same level of wealth in the future.
Figure 1. Share of Value Added by Economic Activity
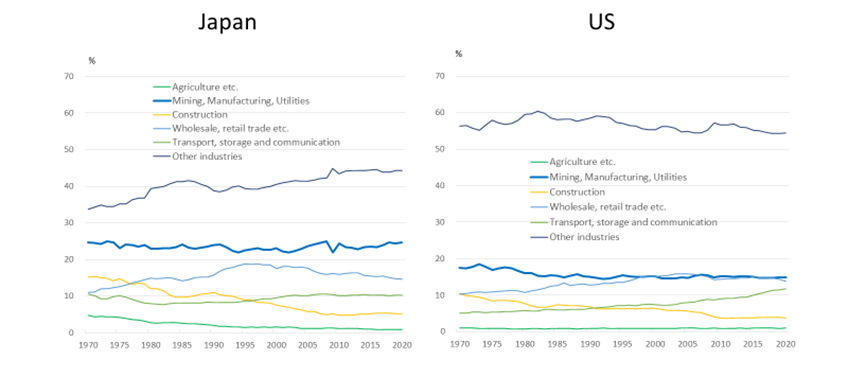
Note: The value added is at constant 2015 prices (US dollars). Source: United Nations
Figure 2: Share of Employment by Industry

Source: Ministry of Internal Affairs and Communications, BEA
Figure 3: The Relationship between Per Capita Income and Manufacturing Share by Prefecture/State

Notes: Japan is based on 2018 FY data. US is based on 2019 data.
The size of the bubbles indicates population size.
Source: Cabinet Office, BEA
The characteristics of energy transition in Japan and the U.S.
What are the characteristics of Japan’s energy transition, with its manufacturing-dependent economic structure? A breakdown of Japan’s CO2 emissions shows that in addition to the energy sector, which is highly dependent on coal- and natural gas-fired power generation, manufacturing industries such as steel and chemicals also account for a considerable share of CO2 emissions (Figure 4). Therefore, in order to promote decarbonization, it is important not only to introduce renewable energy in the power generation sector, but also to reduce emissions in the manufacturing sector.
In the U.S., on the other hand, the transportation sector accounts for a higher share of total emissions (Figure 5). However, since the energy efficiency of the country as a whole is ranked low among developed countries, the industrial sector is also expected to have a large room for emission reduction. Also, the U.S. has a diverse political and economic structure from state to state. For this reason, in understanding U.S. efforts to decarbonize, it is necessary to focus on state-by-state efforts in addition to industry-by-industry efforts.
Figure 4: Composition of CO2 Industry by Emissions in Japan
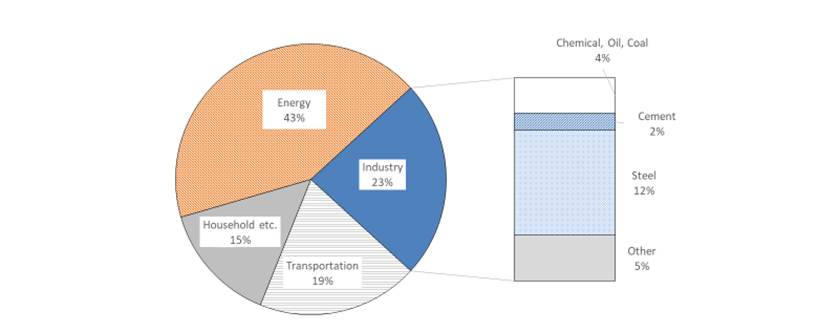
Notes: Based on 2019 data. Source: National Institute for Environmental Studies, Agency for Natural Resources and Energy
Figure 5: Composition of CO2 Industry by Emissions in the U.S.
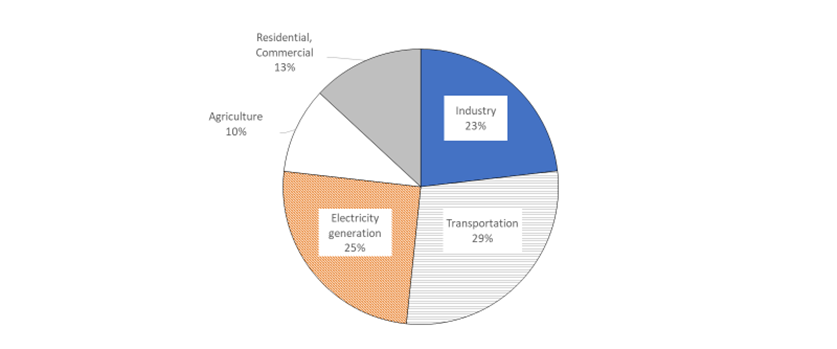
Notes: Based on 2020 data. Source: EPA
Challenges of energy transition
(1) Employment
In Japan, large manufacturing companies are often the agents of change for the energy transition, and unlike in the U.S., layoffs are not common in these companies. Even when older factories are closed in the process of energy transition, employment is generally protected through reassignment within the same company. However, even if layoffs can be temporarily prevented, the sustainability of this response is uncertain, as decarbonization can slow the growth of existing industries. It could also have a negative impact on the country’s overall productivity, as people are less likely to move to growth industries.
On the other hand, in the U.S., start-up activity in the energy sector is stronger due to high job mobility, which would be an advantage in promoting decarbonization. In fact, in Wyoming, start-ups are taking the lead in small nuclear power plants3and hydrogen production projects.4 There are also abundant examples of public policies that support labor migration from declining industries, such as coal, to other industries. For example, the U.S. government set up the “Just Transition Fund,”5 a nationwide effort, and the state of Colorado has extensive support for promoting the labor transition.6 Examining the effectiveness of these policies would be helpful for other regions and countries.
(2) Uncertainty of technological innovation
There are two types of technologies that can enable decarbonization: those that are able to scale today (e.g., wind power) and those that require more development if they are to be both technologically and economically viable at scale (e.g., carbon capture). Successful development of the latter technology would require the investment of a large number of resources to increase the potential for innovation, yet the economic challenges may still not be overcome. A state like Wyoming, which seeks to develop new industries with limited resources, is faced with the difficult decision of how far to invest resources in technological development that involves uncertainty. For example, Wyoming is seeking to host a small nuclear reactor,7 which is scheduled to complete construction around 2030, so long-term strategies are essential. Thus, the energy transition process requires the effective use of limited resources, given the uncertainties of technological innovation.
Personal lessons from the internship
(1) Understand the roles of diverse stakeholders
The implementation of new energy technologies requires coordination with a variety of actors, including federal and state governments, local universities, and the private sector. In the U.S., the stance on decarbonization varies widely from state to state due to the decentralized decision-making under the federal system. Such a U.S. system differs significantly from Japan, where the central government makes comprehensive energy policy decisions. While this decentralized nature has the advantage of allowing some states to quickly adopt progressive initiatives, it also means that the gap with reluctant states widens rapidly, and there is little the central government can do about it. In light of this, the search for appropriate solutions requires an understanding of the institutions and stakeholders that are unique to a country or region.
(2) Accurately identify various constraints
It is not easy to revitalize an economically stagnant region. In every project, the Growth Lab focuses on identifying constraints to growth in various aspects, including demographics, state finances, and transportation infrastructure. This analysis is an important basis for developing growth strategies in the later phases of a project. The process of understanding the historical growth path of a particular region was a useful opportunity to learn the concept of growth diagnosis in the field.
(3) Always looking for potential growth opportunities in the region
What was most impressive to me was that despite the numerous constraints, the Growth Lab researchers were never pessimistic and sought out the unique potential of the region that could be the key to future growth. By effectively combining statistical data with information from experts in various fields and local stakeholders, they were always trying to find clues to growth. I realized that this kind of professional attitude in the development field is important for everyone involved in the public sector.
[1] UW Receives DOE Funding for Carbon Ore, Rare Earth and Critical Minerals Initiatives in Wyoming | News | University of Wyoming (uwyo.edu)
[2] 2020 Wyoming’s Energy Social License Report (uwyo.edu)
[3] Bill Gates’ TerraPower to build its first nuclear reactor in Wyoming coal town (cnbc.com)
[4] Awardees for the Hydrogen Pilot Project – Wyoming Energy Authority (wyoenergy.org)
[6] The Office of Just Transition | Department of Labor & Employment (colorado.gov)
[7] Kemmerer’s locals, leaders eye transition to nuclear-power boom town – WyoFile
African Continental Integration: Lessons from East Africa
By Lucy Luo
The African Continental Free Trade Area (AfCFTA), which came into force in January 2021, is the world’s largest new free trade area since the establishment of the World Trade Organization in 1994. It is expected to facilitate intra-African trade and improve the competitiveness of African industry and enterprises. While there is great momentum behind the agreement, its successful implementation still depends on thoughtful policy choices. In this blog post, we explore what lessons can be drawn from previous regional economic integration experiences.
Economic integration is not new to the African continent. There have been various regional trade blocs, some with overlapping memberships, including the East African Community (EAC), Arab Maghreb Union (AMU), Economic Community of Central African States (ECCAS), Inter-Governmental Authority on Development (IGAD), Economic Community of West African States (ECOWAS), Community of the Sahel-Saharan States (CEN-SAD), Common Market of Eastern and Southern Africa (COMESA), and the Southern African Development Community (SADC). The EAC is one of the oldest customs unions and has been ranked the most integrated regional economic community. Kenya, Tanganyika, and Uganda had a customs union as far back as 1927 under British colonial rule. The EAC was relaunched by the three newly independent states in 1967, has since collapsed in 1977, and was reestablished again in 2000. Today, the EAC consists of seven partner states: The Democratic Republic of the Congo, the Republics of Burundi, Kenya, Rwanda, South Sudan, Uganda, and the United Republic of Tanzania (Exhibit 1).
Given the region’s almost hundred years’ history of integration and disintegration, what lessons can we learn from East Africa that can inform the successful implementation of the AfCFTA?
Exhibit 1: East African Community (EAC) Partner States, 2022
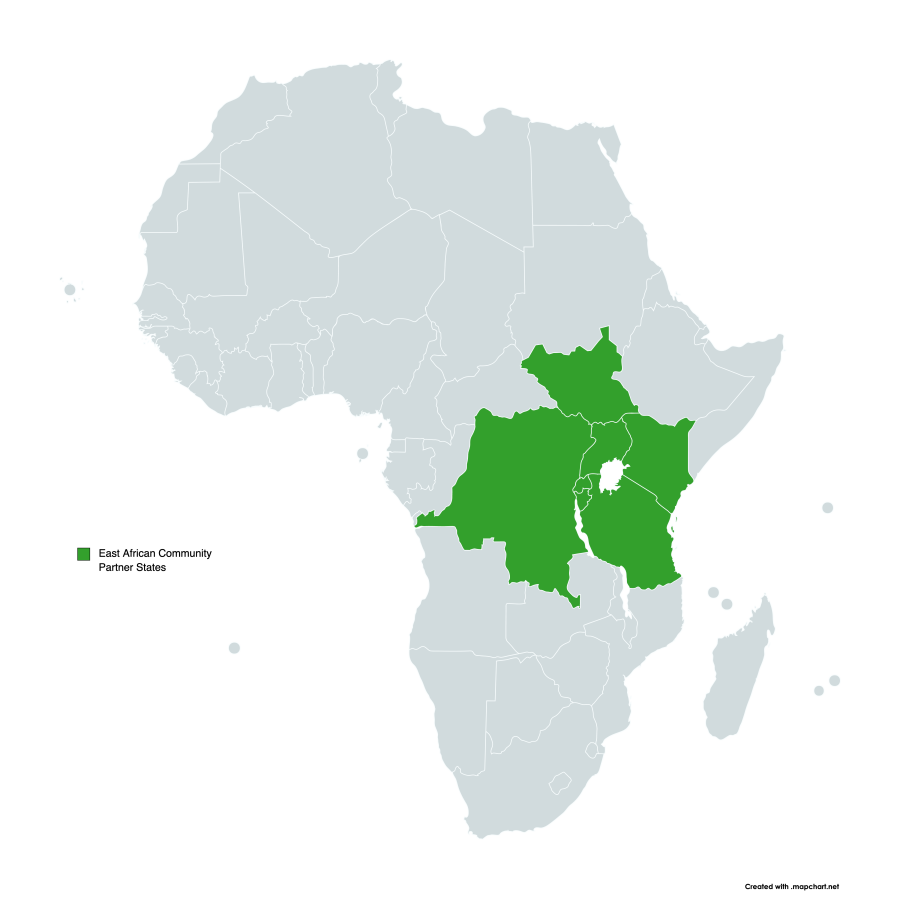
Source: EAC
Lesson 1: Alignment of political will is essential
It should not be a surprise that a successful trade bloc requires genuine political will from all member states. EAC’s collapse in 1977 came after a multi-year deadlock in its highest governing body, the East African Authority, consisting of the presidents of the three founding countries: Kenya, Uganda, and Tanzania. Starting in 1971, the Authority never convened, mainly because of the deteriorating relationship between President Julius Nyerere (TZA) and President Idi Amin (UGA) after Amin installed a coup to overthrow President Milton Obote, who had close ties with Nyerere. The conflict eventually culminated in the Uganda-Tanzania War in 1978.
More than personal clashes, ideological divergence was significant in the region, especially in the context of the Cold War. Tanzania had set a socialist and self-reliant policy agenda since 1967 and received aid and technical assistance from Beijing, while Kenya emphasized private, largely foreign, investments (from Europe and the US). The EAC, however, assumed that advantages of integration would come from free trade, with economic activities conducted by private enterprises and sufficient financial liquidity. The clash of ideologies affected foreign policy and relations, leading to Tanzania eventually closing its border with Kenya in 1977.
This is not to say that states and their leaders must share the same policy agenda or ideology. Rather, for a trade bloc to succeed, states at minimum need to maintain peaceful and stable relations while agreeing on the advantages of integration and the principles of free trade. Moreover, when divergence of views or interpretations arises, there should be mechanisms in place for dialogues that facilitate problem-solving and conflict resolution. These factors were lacking in the first iteration of the EAC.
Lesson 2: Imbalanced trade and distribution can threaten integration
The lack of political alignment was not the only obstacle to East African integration. Economically, not all member states benefited from the EAC equally. Tanzania and Uganda’s trade deficits increased during the first EAC, almost entirely attributable to the growing net importation of manufactured goods from Kenya. In fact, Ugandan exports in absolute value declined continuously after 1970. By contrast, Kenya’s trade share in the EAC increased continuously. Kenya’s exports were divided almost evenly between Tanzania and Uganda, whereas both Tanzania and Uganda traded mostly with Kenya as their economies were heavily dependent on importing manufactures. This demonstrates that free trade did not substantially change patterns of production between the three countries, as a tariff was not the binding constraint for specialization in production. Tanzania and Uganda still produced a similar range of primary products over time.
Such distributional effects are not entirely surprising. What is important for a trade bloc to sustain is to compensate for the unequal benefit distributions. The first EAC intended to build in mechanisms “to correct the imbalance in industrial development.” The East African Development Bank (EADB) charter stipulated 38.75% of EADB investments should be made to Tanzania and Uganda and only 22.5% to Kenya. However, compliance only went so far as loan approvals and not actual disbursements. Tanzania ended up with 39.2% of the loans, followed by Kenya with 34.5% and Uganda with 26.3%. These imbalances likely contributed to the collapse of the first EAC.
When we look at the product mix that are traded between the three countries today, similar dynamics persist, in which Tanzania and Uganda export mainly primary products to Kenya (Exhibit 2).
Exhibit 2: Tanzania and Uganda’s export product mix to Kenya, 2019

Source: The Atlas of Economic Complexity, Harvard’s Growth Lab
The second iteration of the EAC also did not seem to have structurally reoriented trade towards more intraregional trade, either (Exhibit 3). Why, then, does integration make sense for countries other than Kenya?
Exhibit 3: Intra-regional trade growth was part of a general increase, not a structural reorientation
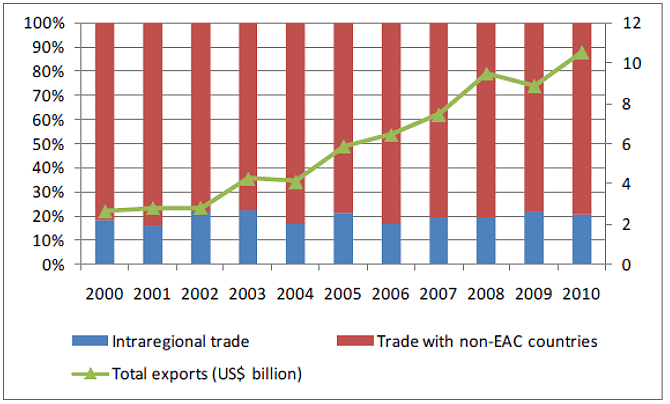
Source: ECDPM Discussion Paper No.186
There has been literature suggesting that welfare gains from integration are mostly from a reduced common external tariff rather than more intraregional trade. This is confirmed by empirical evidence from the European Union (EU), where extra-regional trade had more impact on growth than intra-regional trade. As a trade bloc, all members benefit from having more negotiating power against external trading partners or unions. Therefore, states and their leaders need to consider not only intraregional trade but also interregional dynamics to fully assess the benefits of integration.
In sum, even though regional integration may have imbalanced distributional consequences, the consideration of trade and negotiations with external actors may outweigh the disadvantages brought by the former. In addition, a trade bloc can build in mechanisms that compensate for the unequal distributional effects. However, it is important to have checks and balances within the governance structure to ensure that these mechanisms are properly implemented.
Lesson 3: Monitor non-tariff barriers
Even within a well-established trade bloc where tariffs are eliminated, non-tariff barriers (NTBs) can be significant. Within the EAC, while various customs and trade facilitation measures1, as well as tax-like measures2, have been resolved, many still persist. Additional NTBs include quality and safety standards and import bans (Exhibit 4).
Exhibit 4: Resolved and unresolved non-tariff barriers within the EAC, 2016
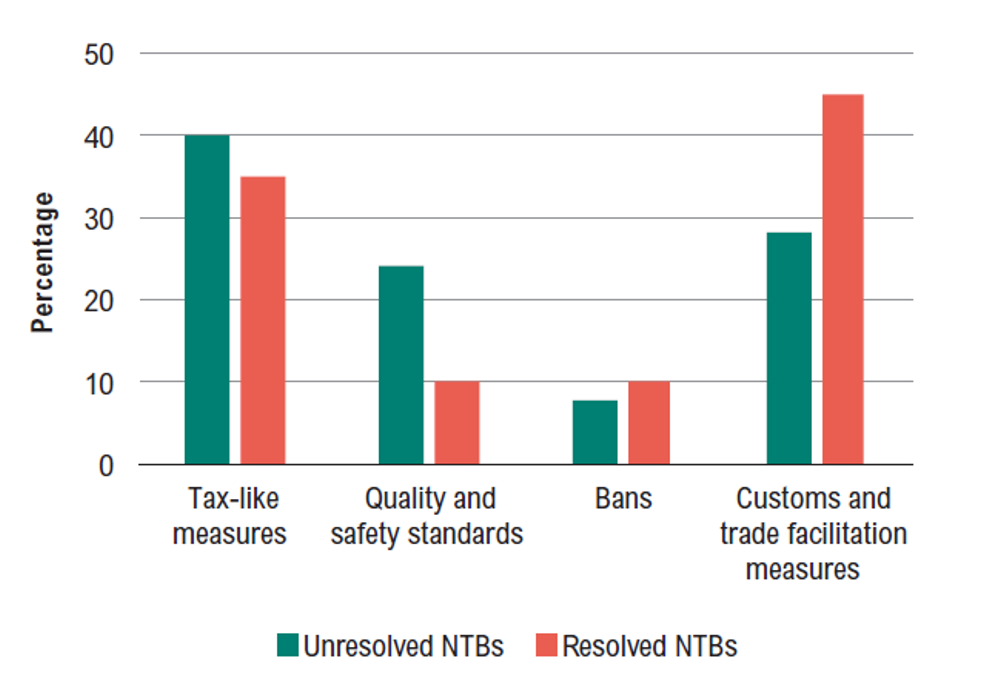
Source: ODI, 2016
When there is a lack of political will for integration, the benefits of eliminating tariffs may well be offset by the introduction of NTBs. Calo-Blanco and Naya (2006) found that governments of economically integrated countries tend to replace tariffs with NTBs when their priority is to protect the nation’s firms.
NTBs are at least three times more restrictive than regular customs duties, as the United Nations Conference on Trade and Development (UNCTAD) estimates. Various empirical studies have found reducing NTBs, such as improving infrastructure and institutions, potentially has far larger gains than lowering tariff barriers. An UNCTAD report suggests that African countries could gain US$ 20 billion in GDP growth by tackling such NTBs at the continental level.
Therefore, it is important to monitor and establish mechanisms for resolving NTBs for a trade bloc to be truly welfare-enhancing. The EAC recognizes this and has taken important steps to eliminate existing and avoid new NTBs. In 2009, the EAC agreed to establish a Monitoring Mechanism of NTBs, and the Secretariat was tasked with maintaining a regularly updated inventory list of resolved and unresolved NTBs. The EAC subsequently enacted the EAC Elimination of Non-Tariff Barriers Act of 2017 to provide a legal framework for monitoring and addressing NTBs in the region. While there has been progress in eliminating NTBs, the Committee on Trade Remedies, which determines compensation for NTB-related losses, is not yet operational due to political stalemate. This again highlights the importance of political will as a prerequisite for integration.
As the AfCFTA came into effect, it has also created an online mechanism for reporting, monitoring and eliminating NTBs, which has been operational since 13 January 2020. NTB complaints submitted online are sent to formally nominated government officials (National Focal Points) who monitor and eliminate the barriers. However, the EAC experience tells us that having a monitoring mechanism alone may not ensure execution. Transparency and awareness will help, but there needs to be sufficient political will among the governments to ultimately resolve NTBs.
Drawing from these three lessons from EAC’s experience, I would recommend the following key considerations for AfCFTA to have a higher chance of success:
- Build in mechanisms to facilitate problem-solving and conflict resolution to avoid political stalemate between states.
- Individual states should consider not only trade within the region but also the trade bloc’s external dynamics before deciding how willing they are to cooperate with each other.
- Continue building in mechanisms to compensate for the unequal distributional effects of a trade bloc, such as via the African Development Bank. More importantly, build in checks and balances within the governance structure to ensure that these mechanisms are properly implemented.
- Continue monitoring and publicizing non-tariff barriers and tracking the progress for their elimination.
- Provide a legal framework to address NTBs and ensure that it can be operational (use the abovementioned conflict resolution mechanism if necessary).
1 Cost-increasing measures incurred as a result of the monitoring and enforcement of trade facilitation and customs rules (excluding the enforcement and monitoring of standards and quality and safety measures).
2 Measures that impose monetary costs on imports (including non-application of preferential tax arrangements).
What we learn from WAEMU for regional integration on the African continent
By Julia Conrad
Created in 1994, the West African Economic and Monetary Union (WAEMU) was established as a trade and currency union and encompasses the eight countries Benin, Burkina Faso, Côte d’Ivoire, Guinea-Bissau, Mali, Niger, Senegal, and Togo1– all of which are equal members of the regional and economic union ECOWAS, the Economic Community of West African States.2 The adoption of a common currency among states is regarded as one of the highest forms of economic integration.3 Literature suggests that the establishment of a monetary union leads to increased economic activity through a rise in trade or investment flows between member countries and higher macro-economic stability.4,5, 6
WAEMU as an economic union emerged from colonial arrangements. Critics also describe it as “colonial relic” that is meant to preserve the dominance of Paris and French companies in West Africa.7 It was initially aimed at reducing transaction costs, facilitating the free movement of persons, goods, services, and capital among its members.8 The IMF and some global bodies have consistently described WAEMU as successful regional bloc with a high level of economic integration.9,10 Our analysis at the Growth Lab has found little evidence for this assessment. In contrast, it seems that many critics are right in pointing towards worrying low levels of trade and investment across the bloc. They claim that low inflation can be regarded as WAEMU’s single achievement, and even then, the question remains whether anti-inflationary governance is appropriate in the development context of Africa.11
Four working principles are at the core of WAEMU: (1) a peg of its exchange rate to the French currency, (2) free income and capital transfers within the zone and with France, (3) the French treasury promises to lend euros to the Central Bank of West African States bank (BCEAO) if they exhaust own foreign exchange reserves (this “convertibility guarantee”), and in return (4) the BCEAO must deposit at least 50% of its foreign currency reserves in a special ‘operations account’ of the French treasury – a condition that was finally lifted in 2019.12
All Euro-XOF (CFA franc) conversions used to pass through this operations account. When it was in credit, the French treasury paid interest and when it was in debit, the guarantee was active – a scenario that only happened back between 1980-1993. A French representative also used to sit on the board of the BCEAO, but this was recently also changed.13,14 The experience of WAEMU has even animated ECOWAS leaders to envisage the implementation of the currency “Eco” across the whole of West Africa, but its launch has been repeatedly postponed, last in 2020.15 A Pan-African monetary union was also part of earlier AfFCTA discussions. Its vision was partly realized under the introduction of a Pan-African Payments and Settlement System (PAPSS) in early 2022.16
“CFA franc” is essentially the name of the only two currency unions on the African continent under the West African CFA franc (XOF) and the Central African franc (XAF). Although separate, the two currencies have always been at parity and are effectively interchangeable.17 Our analysis focused on the West African CFA franc to understand what the integration under one monetary system has meant for its members’ economic stability and regional economic activity. A special focus was on the question of whether integration has led to the promise of increased levels of regional trade or investment, similar to what has been observed among member countries after the establishment of the EU.18 We also looked at how WAEMU compares in these areas with other regional economic communities (RECs) on the continent.
ON WAEMU
WAEMU consists of eight relatively small states with similar market structures of which all but Guinea Bissau (Portuguese) share French as an official language.19 Some annual economic statistics of WAEMU’s member countries (before Covid-19) are summarized in the table below.
Table 1: Overview of WAEMU member countries
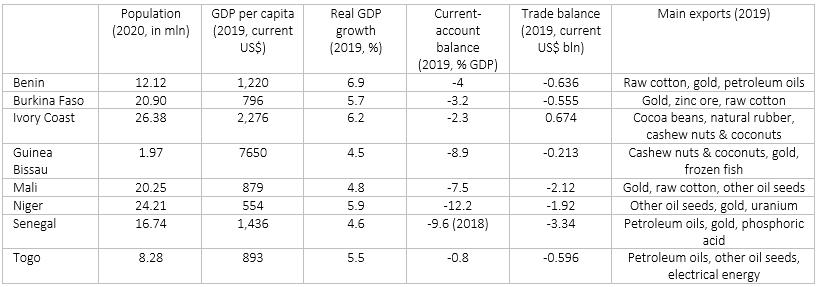
Source: World Bank Database, Atlas of Economic Complexity
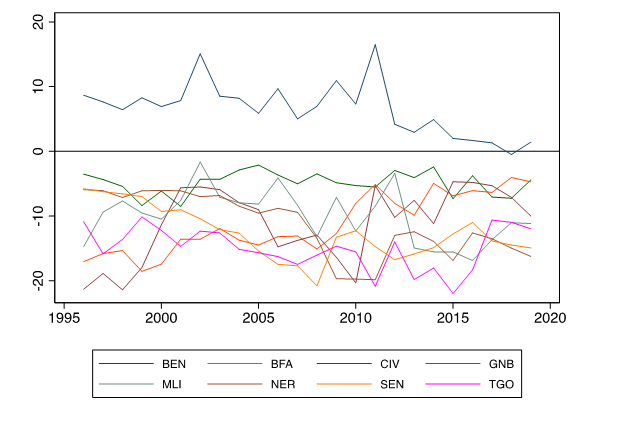
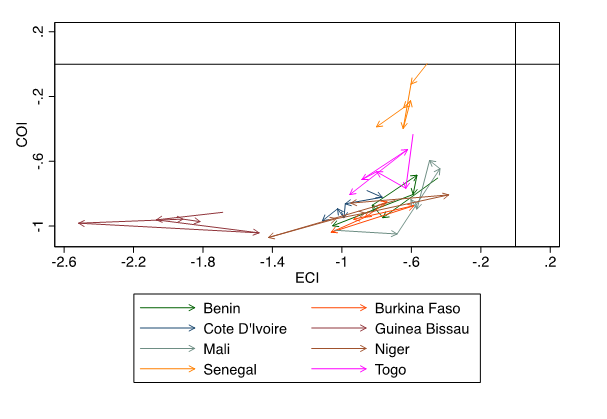
Apart from Ivory Coast, member states’ trade balance over the past 20 years has been consistently negative (see Graph 1). WAEMU states also perform relatively poor on Economic Complexity measures, as captured by the Economic Complexity Index (ECI) and Complexity Outlook Index (COI) in Graph 2. The ECI summarizes a country’s capabilities as regards production possibilities while the COI reflects the availability of good diversification opportunities for its export basket. The graph shows that WAEMU states have remained within the negative ECI and COI zone indicating little space to improve and few opportunities for economic diversification. For most WAEMU countries, the arrows also direct to the lower left of the graph, meaning that countries have become even less complex between 2015-19.
Graph 1: Trade balance of WAEMU countries from 1996-2019
Graph 2: ECI and COI evolution of WAEMU countries between 2015-2019
COMPARISON WITH OTHER RECS
We compared WAEMU’s export structure with other RECs on the continent to see if there was any visible impact of sharing the CFA franc as currency on trade. The following table gives an overview of the selected RECs.
Table 2: Overview of RECs included in the Analysis
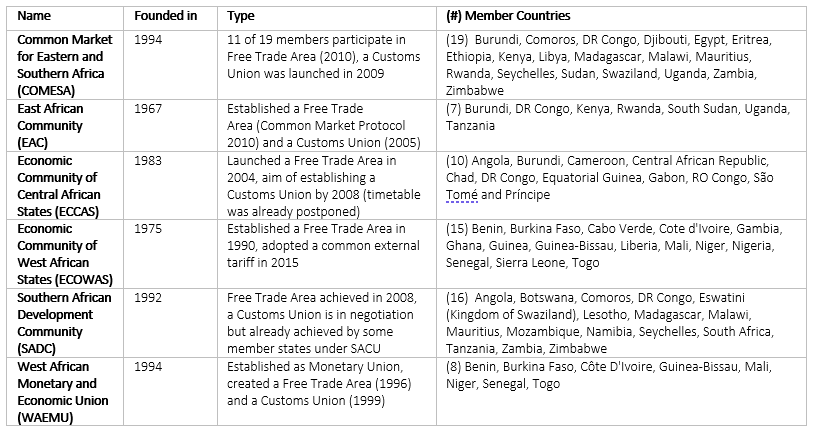
Note: RECs in Africa that are not included are The Community of Sahel–Saharan States (CEN-SAD), The Intergovernmental Authority on Development (IGAD), The Arab Maghreb Union (AMU) and The Southern African Customs Union (SACU). All information is based on own desk research.
As regards the economic development level, SADC, COMESA and ECCAS show a higher average income level, reaching a GDP per capita (current $) of over $2,500 GDP in 2019.20 For ECOWAS, WAEMU and EAC it was below $1,500. Unemployment has been especially high among SADC states (above 10% on average since 1999) while it was lowest (below 5%) in EAC and WAEMU. Average Inflation in WAEMU has been relatively low and remained below 5% since 2010. Since 2010 external debt in all RECs has been rising. The government’s debt burden was highest in COMESA, ECOWAS and EAC in 2019, with average debt levels of above 50%.
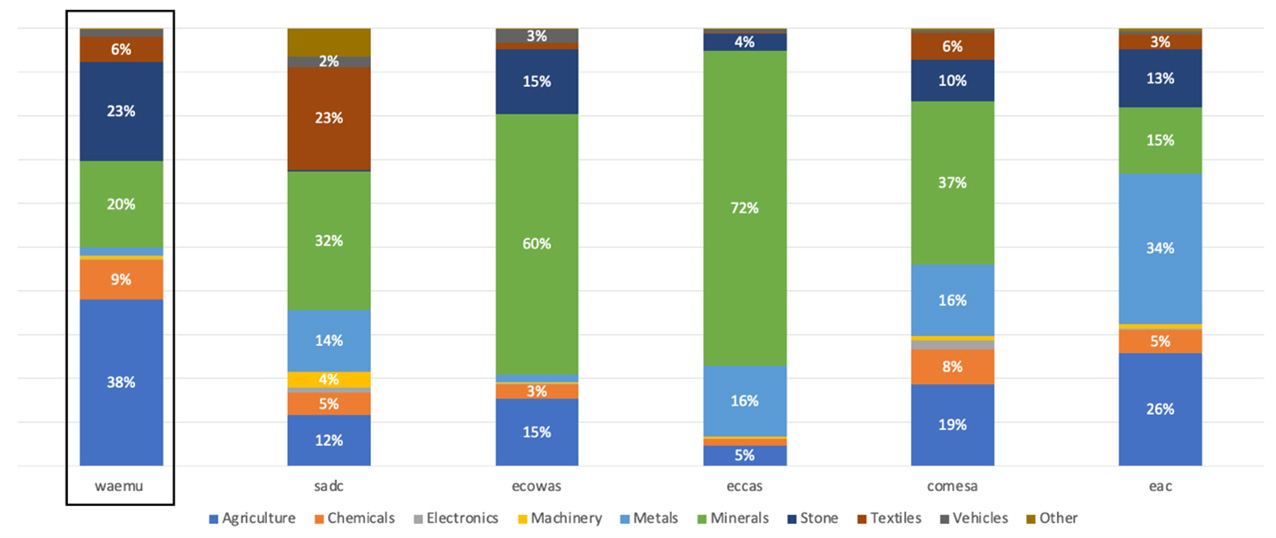
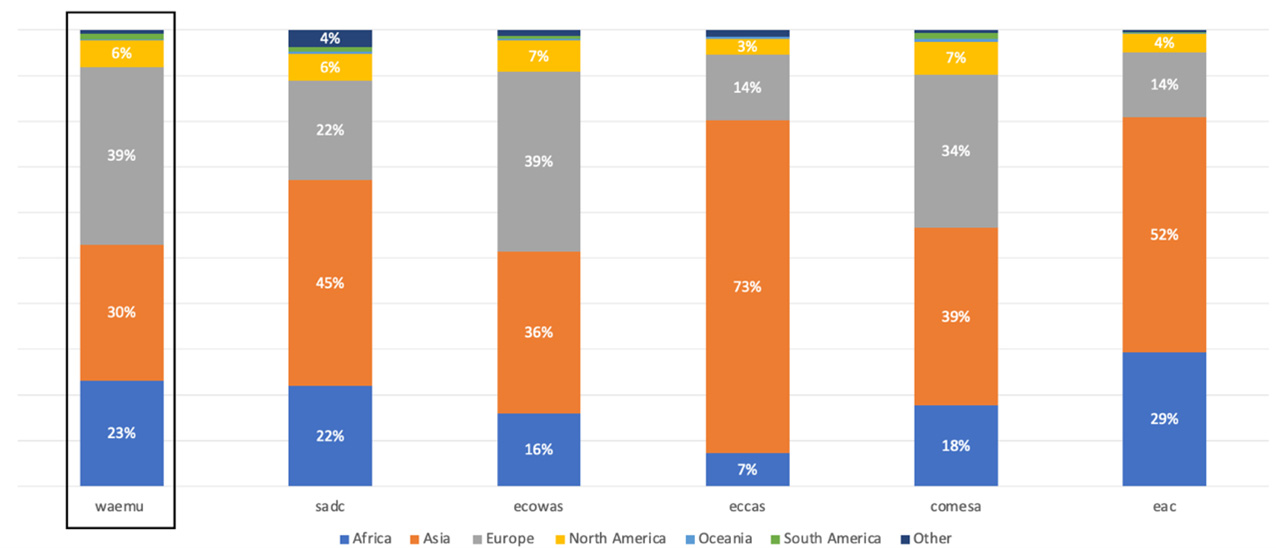
The composition of export baskets varies but it is in all RECs dominated by minerals, non-transformable commodities, and agricultural products, which are not integrated in regional supply chains and are hence shipped abroad (see Graphs 3 & 4). Exports in ECOWAS and ECCAS have mainly (>=60%) consisted of minerals. Minerals export in SADC and COMESA has been less significant but was still high (~1/3). In WAEMU, agricultural products (cocoa, raw cotton, cashew, and cocoa nuts) dominate the export basket, followed by stones (primarily gold). Interestingly, WAEMU also has the highest share of chemical products that is exported (Senegal, for example, exports 8% of the world’s phosphoric acids used in fertilizers21 ). With $9.6 billion in total export value in WAEMU and $38.5 billion in ECOWAS, Europe remains the primary trade destination in West Africa, accounting for 39% of all exports in both RECs. For East and South African blocs, Asia has overtaken Europe as the primary export destination. In ECCAS, Asia makes up as much as 77% of all exports. With 29% the EAC has had the highest share of exports within the African continent.
Graph 3: What did RECS export in 2019?
Graph 4: Where did RECS export to in 2019?
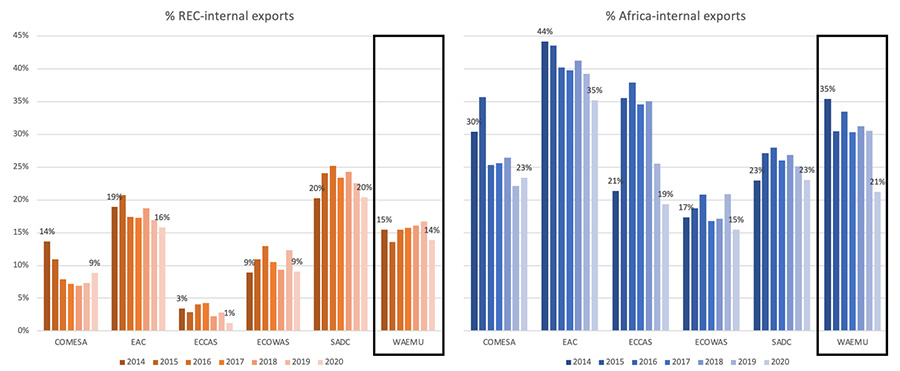
Graph 5 compares the share of regional, which means REC-internal and Africa-internal, exports for the period 2014 to 2020. Community-internal export was highest among SADC and EAC countries, with 20% and 16% of internal exports in 2020 respectively. Despite the promise of facilitated trade through a common currency, WAEMU’s internal trade business did not stand out, neither REC-internally nor for exports to the continent, and it was mainly reliant on refined oil. It was equally low in per capita terms, in contrast to SADC for example.
Graph 5: Regional exports 2014-2020
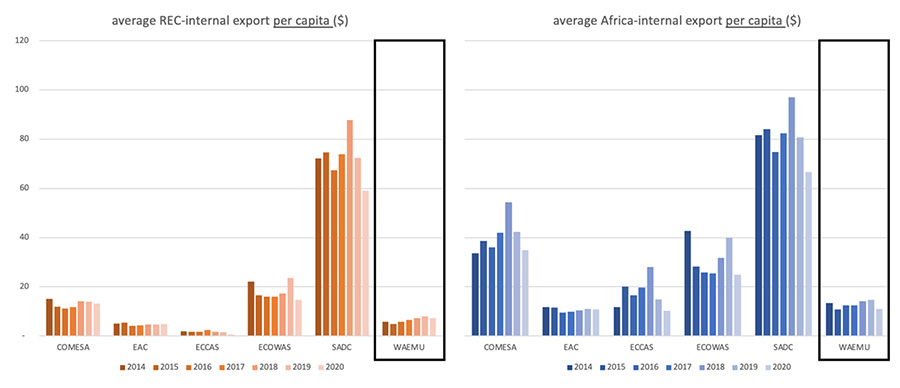
Graph 6: Regional FDI flows 2003-2019
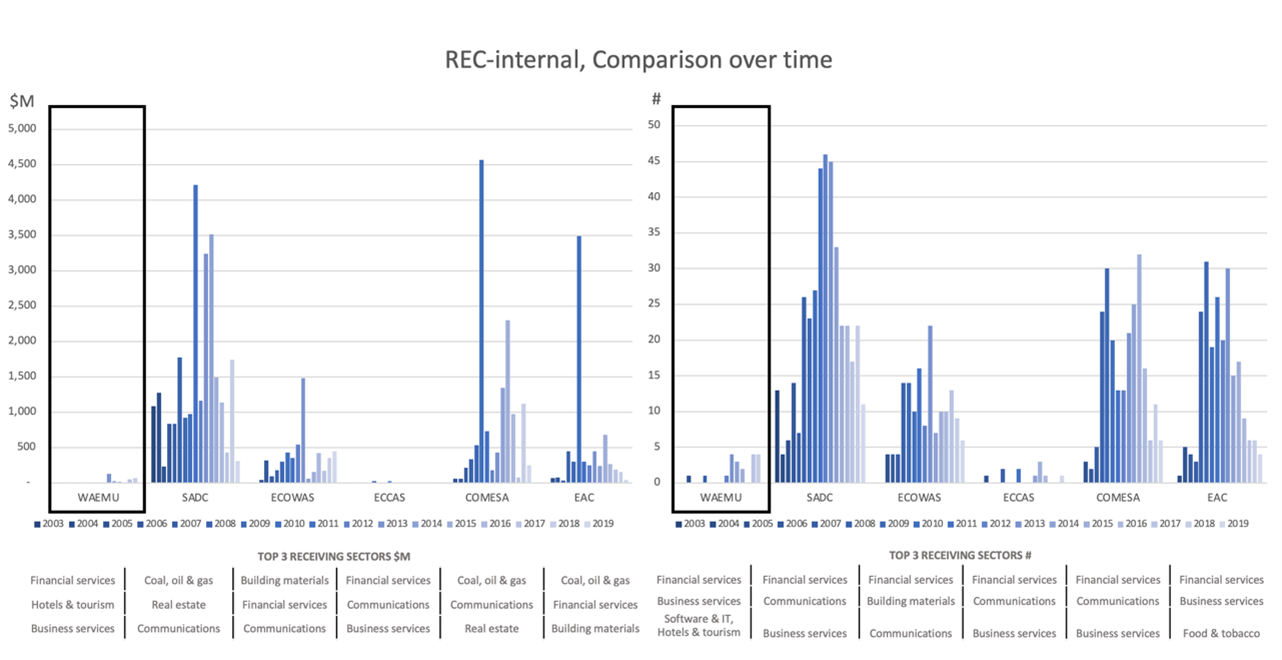
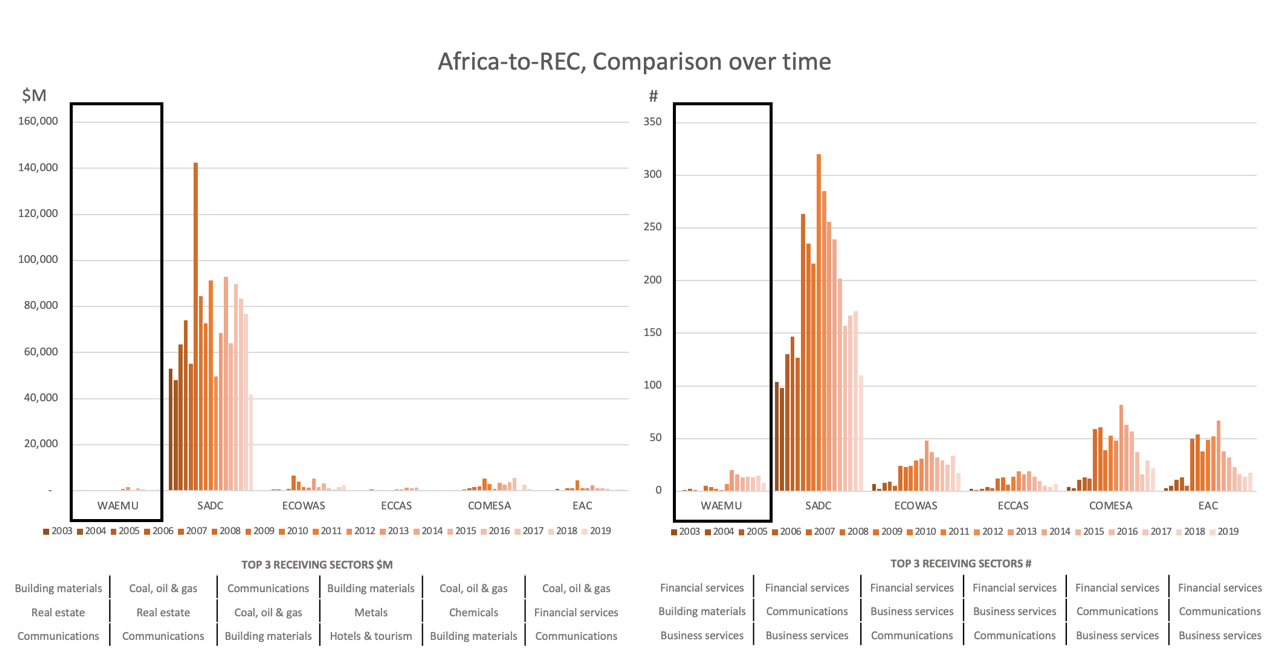
Note: Calculations are based on investment deal announcements as captured by fDi Markets.
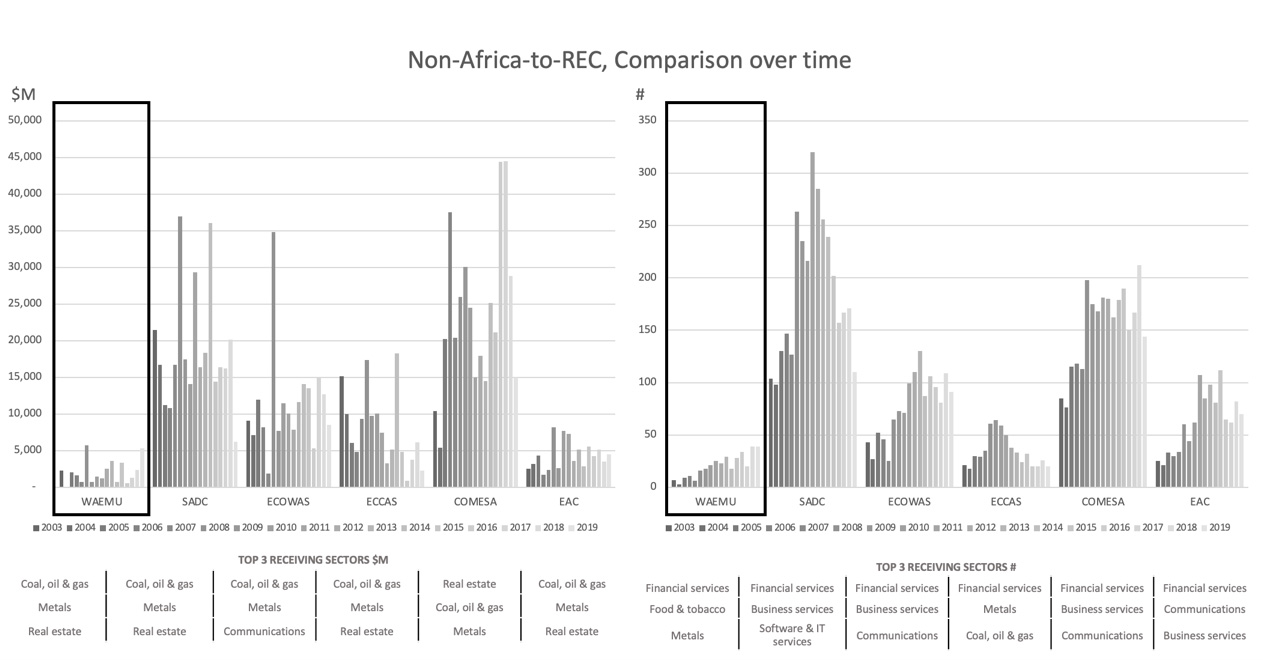
WAEMU has similarly not attracted more bloc-internal investment (Graph 6). Between 2003-2019, the group’s internally announced deals were only a small fraction (<10%) of the deals within EAC, which is a grouping of a similar size. REC-internal announcements were most frequent in SADC where almost 400 projects of more than $25 billion were planned. WAEMU lags similarly behind in generating investments from the continent as a whole. Again, investors’ interest was concentrated in SADC where more than 3,200 deals of $1.25 trillion from Africa were reported. Interestingly, the volume of capital inflow from outside Africa focused on COMESA. Across all RECs, investments centralized in the financial and business services sectors (as reflected by # of deals) while the coal, oil, gas, and metals sectors received the most capital.
MAIN TAKEAWAY
The experience of WAEMU shows that the formal establishment of a free trade (and single currency) regime alone does not automatically imply an increase in economic activity across member countries. We found that WAEMU-internal and Africa-wide trade has remained relatively limited. This is likely because other serious barriers continue to exist beyond those impacted by trade terms and a shared currency, including the well-documented lack of necessary logistical networks, and streamlined procedures for customs in the region. The insecurity in border areas, for example in Eastern Burkina Faso’s area close to Togo and Benin, has also become a major concern that is hindering smooth transportation in the area22. It is commendable that regional communities and trade facilitation agreements have formed and continue to exist across the continent. But these agreements are not sufficient to increase trade and investment on their own. This is true for both internal trade and investment within the community and the ability of the community to attract transformative business investment from outside. This suggests that larger trade agreements like AfCFTA may lead to limited impact only if negotiated policies and terms that aim to facilitate trade and capital flows lack a system of strict enforcement and external circumstances, such as infrastructure and security, remain unfavorable23.
Julia Conrad is currently pursuing a Master in Public Administration degree at Harvard Kennedy School (2023). Previously, she worked for five years at the International Finance Corporation (World Bank Group) in Dakar (Senegal), where she managed a portfolio of micro- and agriculture finance projects across Africa. Her studies at Harvard have focused on Infrastructure Development, Development Policy, and Climate Change. She also has a BSc in International Economics from the University of Tuebingen and a MEc in World Economics from the University of Finance and Economics in Shanghai.
———————–
1Website of the West African Economic and Monetary Union. “About UEMOA.” http://www.uemoa.int/en/about-uemoa(last visited: 23 July 2022)
2Website of the Economic Community of West African States. “Member States.” https://ecowas.int/?page_id=381 (last visited: 23 July 2022)
3 Britannica Online Encyclopedia. “Economic Integration.” https://www.britannica.com/topic/economic-integration(last visited: 23 July 2022)
4 Frankel, Jeffrey A. & Andrew K. Rose. “Estimating the Effect of Currency Unions on Trade and Output.” Quarterly Journal of Economics CXVII, 2 (May 2002): 437-466. https://www.nber.org/papers/w7857(last visited: 23 July 2022)
5Glick, Reuven & Andrew K. Rose. “Does A Currency Union Affect Trade? The Time-Series Evidence.” European Economic Review, 2002, v46 (6 June): 1125-1151. https://www.nber.org/papers/w8396 (last visited: 25 July 2022)
6 Micco, Alejandro, Ernesto Stein, Guillermo Ordoñez, Karen Helene Midelfart & Jean-Marie Viaene. “The Currency Union Effect on Trade: Early Evidence from EMU.” Economic Policy 18, no. 37 (2003): 317–56. http://www.jstor.org/stable/1344738 (last visited: 25 July 2022)
7 Pilling, David. “A revolution in Africa’s relations with France is afoot.” Financial Times. 31 December 2019. https://www.ft.com/content/8894ad6e-2650-11ea-9a4f-963f0ec7e134 (last visited: 25 July 2022)
8 Website of the West African Economic and Monetary Union. “The Amended Treaty.” http://www.uemoa.int/en/amended-treaty(last visited: 25 July 2022)
9 Ouattara, Alassane D. “The West African Economic and Monetary Union (WAEMU) – Facing the Challenges of the Future.” IMF. 30 June 1998. https://www.imf.org/en/News/Articles/2015/09/28/04/53/sp063098(last visited: 25 July 2022)
10Pangea Risk. “Special Report: Africa’s Common Markets Compete for Trade and Investment.” 8 March 2021. https://www.pangea-risk.com/wp-content/uploads/2021/03/SPECIAL-REPORT-AFRICAS-COMMON-MARKETS-COMPETE-FOR-TRADE-AND-INVESTMENT.pdf(last visited: 25 July 2022)
11Samba Sylla, Ndongo. “Moving forward to African Monetary Integration.” Africa Development/Afrique et Développement, 2020, Vol. 45, No. 2 (2020): 39-58. https://www.jstor.org/stable/26979255(last visited: 25 July 2022)
12 Pilling, David. “A revolution in Africa’s relations with France is afoot.” Financial Times. 31 December 2019. https://www.ft.com/content/8894ad6e-2650-11ea-9a4f-963f0ec7e134(last visited: 25 July 2022)
13Mieu, Baudelaire. “France begins transfer of €5bn to BCEAO as part of CFA franc reform.” The Africa Report. 5 May 2021. https://www.theafricareport.com/85566/france-begins-transfer-of-e5bn-to-bceao-as-part-of-cfa-franc-reform/ (last visited: 25 July 2022)
14 Wilson, James. “The CFA franc reforms are more symbolic than transformative.” LSE Blog. 19 March 2020. https://blogs.lse.ac.uk/africaatlse/2020/03/19/cfa-franc-reforms-monetary-policy-symbolic-colonialism/ (last visited: 25 July 2022)
15 Mugabi, Isaac. “West Africa’s Eco currency plan remains a pipe dream.” Deutsche Welle (DW). 2 July 2021. https://www.dw.com/en/west-africas-eco-currency-plan-remains-a-pipe-dream/a-58136111 (last visited: 25 July 2022)
16Ogbalu, Mike III. “Boosting the AfCFTA: The role of the Pan-African Payment and Settlement System.” Brookings. 11 February 2022. https://www.brookings.edu/blog/africa-in-focus/2022/02/11/boosting-the-afcfta-the-role-of-the-pan-african-payment-and-settlement-system/ (last visited: 25 July 2022)
17 Wikipedia. “CFA franc.” https://en.wikipedia.org/wiki/CFA_franc#cite_note-2020_nzaou_kongo-1 (last visited: 25 July 2022)
18Daan Freeman, Dean, Gerdien Meijerink & Rutger Teulings. “Trade benefits of the EU and the Internal Market.” CPB Netherlands Bureau for Economic Policy Analysis. January 2022. https://www.cpb.nl/sites/default/files/omnidownload/CPB-Communication-Trade-benefits-of-the-EU-and-the-Internal-Market.pdf (last visited: 25 July 2022)
19Website of the BCEAO. “Member States.” https://www.bceao.int/en/etats-membres (last visited: 25 July 2022)
20One must note that differences of income level are enormous REC-internally. For example, in COMESA and SADC, the Seychelles’ GDP per capita (current $) was more than 34-times that of Mozambique. In ECCAS, Equatorial Guinea’s per capita GDP was even than 37-times that of Burundi.
21Retrieved from The Atlas of Economic Complexity. The Growth Lab. Harvard Kennedy School of Government. https://atlas.cid.harvard.edu/explore?country=undefined&product=5895&year=2019&productClass=HS&target=Product&partner=undefined&startYear=undefined (last visited: 25 July 2022)
22 Salau, Sulaimon. “Poor infrastructure, insecurity hinder cross-border trade.” The Guardian. 8 May 2022. https://guardian.ng/business-services/poor-infrastructure-insecurity-hinder-cross-border-trade/(last visited: 25 July 2022)
23USAID. “West Africa Regional: Economic Growth and Trade.” Last updated 21 July 2022. https://www.usaid.gov/west-africa-regiona/economic-growth-and-trade (last visited: 25 July 2022)
A Free Trade Agreement Across the African Continent: Where Are the Export Opportunities for Nigeria?
After being fully implemented, the African Continental Free Trade Area (AfCFTA) is going to be the biggest Free Trade Agreement (FTA) ever in population and geographical size: more than fifty countries have been working since 2015 on tariff reductions in goods, rules of origin and procedures, technical barriers, or trade-in services, just to mention some topics. Considering that intra-regional trade is only 17% of total African exports (compared to 59% in Asia or 69% in Europe)1, this FTA could be a big step toward the goal of increasing exports (including diversification and more complex products) between African countries.
However, if we want to know where the export opportunities for a particular country are, it is hard to know where to start. The Agreement includes and addresses so many topics and issues that are easy to get lost. For instance, what are the binding constraints to intra-regional trade in practice and how is the AfCFTA going to impact them? Are those binding constraints the same for every sector in each country? What is the current situation in terms of tariffs and non-tariff barriers and how is that going to change?
I spent eight weeks trying to find an answer to these questions for Nigeria as part of a research sprint with Harvard’s Growth Lab. I analyzed the tariffs that Nigerian firms face when trying to export to other African partners. The main idea was to find and identify products where Nigeria might have comparative advantages in productive capabilities and where the other countries are currently imposing high import tariffs that the AfCFTA is going to reduce. Let’s go.
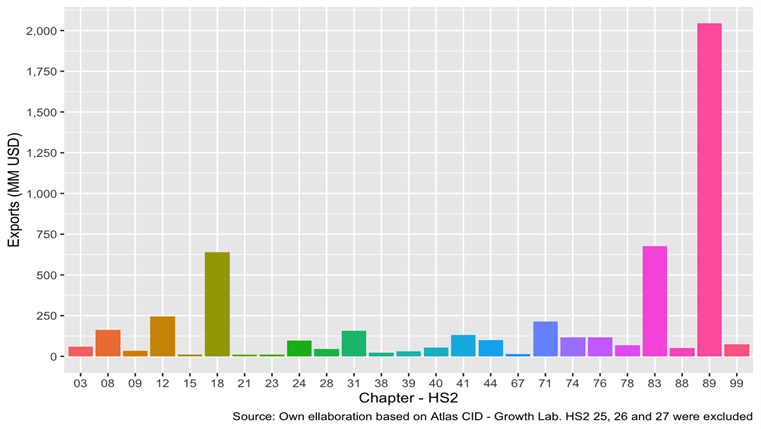
Nigeria mainly exports oil derivates (see Figure 1), and in those chapters (2-digit level of the Harmonized System (HS)) where exports were relatively high in 2019 (see Figure 2), we do not see very promising stories. In chapter 89 — which represents ships, boats, and floating structures — exports are mainly scrap vessels. In chapter 83, the data is just capturing a sporadic and unique export of metal articles that occurred in September 2019 and were not repeated in any other year. In chapter 18, we only find exports of raw or roasted cocoa beans with no further industrial processes.
Figure 1: Nigeria’s exports by sector

Figure 2: Nigeria’s exports in 2019 by Chapter (HS 2)
Therefore, for Nigeria, we need to dig deeper to look beyond the exports that dominate current trade and to those that might be nascent now but represent strategic growth opportunities. To find products with potential export opportunities we need to develop a systematic methodology that could be applied to every HS chapter. To develop such an approach, I take advantage of a detailed dataset that includes every import tariff that Nigeria is paying when trying to export to African countries.
Nigeria is part of ECOWAS, a custom union composed of 15 countries2, so for these countries, Nigeria is already paying 0% of import tariff. However, for the rest of the countries, the average levels are considerably high, as shown in Figure 3.
Figure 3: Tariff faced by Nigeria when exporting, Simple and Weighted (Exports 2019) Average

Considering that Nigerian exporters face high tariffs in some countries, a natural question arises: which products are going to have the highest tariff reduction? Additionally, it is useful to focus on products that have two characteristics: (1) they are being exported somewhere by Nigeria (let’s say, exports were higher than USD 3 MM in 2019), and (2) they faced a high average tariff (let’s say higher than 20%). Figure 4 shows products along these two dimensions.
Figure 4: Nigeria’s Total Exports and Tariffs faced in African Countries (excluding ECOWAS)

If we focus our attention on those products that have these characteristics, we find 10 products where Nigerian exporters would be likely to benefit from the FTA. These represent perhaps the clearest opportunities to increase exports on the intensive margin. Let’s look at some of these products, for example, crustaceans and beers, to understand the opportunity space better.
In the first case, a quick analysis in Table 1 shows us that Nigeria is exporting more than 90% of its crustacean exports to European countries, and that the effectively applied tariff in those countries is around 5%, while the average tariff to export to African countries is greater than 20%. Considering that Nigeria is the second-largest producer of farmed fish in the continent, and that many businesses are small and medium firms, it would be relevant to understand what type of characteristics the exporting firms share and how they succeeded in obtaining the required certifications to access into markets with high-quality standards such as the European Union or the US. On the other hand, the current production in Nigeria seems to be lower than its local demand. Therefore, to increase exports to African partners, Nigeria would seem to have to increase the local production3.
Table 1: Total Nigeria’s Exports 2019 of Crustaceans (HS4 0306)
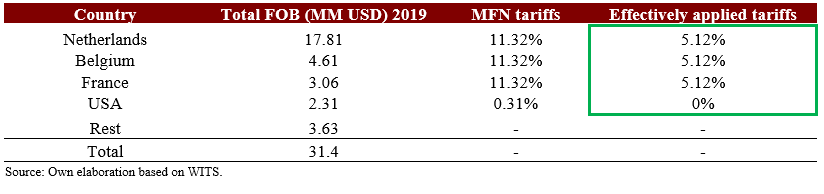
The second case, beer, is quite different. As shown in Table 2, Nigeria exports to countries with 0% of applied tariff but also to Cameroon, which represents more than 20% of exports but where the tariff is 30%. This is in line with the average tariff across all the African countries, 26%. How is Nigeria successfully exporting to Cameroon even when the applied tariff is so high? How many firms are exporting beer to Cameroon? Is the tariff reduction going to incentivize more exports? To answer these questions, it would be indispensable to better understand the business profile and perspectives of the largest companies, like Nigerian Breweries.
Table 2: Total Nigeria’s Exports 2019 of Beer (HS4 2203)
The same analysis for the other 8 headings also gives interesting results. In general, Nigeria is currently exporting these products to countries with low tariffs, so it is possible that the AfCFTA could increase export opportunities in those products (and perhaps in other goods that are not being exported due to high tariffs and we are not detecting in our exercise).
This analysis is my first attempt at combining data from current exports and import tariffs in a systematic way to identify where export opportunities could be. The cutoff could be modified (1 instead of 3 MM, or 15% instead of 20% of import tariff), and one could also study or analyze the imports of the other African countries to better understand Nigeria’s role in those markets and the potential advantage that Nigeria could have with the AfCFTA compared to other exporters.
Since we are just using import tariffs and trade data, we must continue asking questions and exploring other trade aspects, such as non-tariff barriers or rules of origin and procedures or studying specific industries that could get positive and significant gains with the Agreement. Analyses like this are nevertheless important because within the complex spaced of trade and industrial policy in the context of new developments, like AfCFTA, it is often difficult for policymakers and other stakeholders to know where to start looking for opportunities.
A key advantage of this approach is that it can be easily repeated in any other African country, and by using it we can get initial ideas of which industries (in each country) could benefit through AfCFTA in terms of tariff reductions, and therefore inform local strategies in support of local businesses.
1See https://www.brookings.edu/blog/africa-in-focus/2019/02/22/figures-of-the-week-increasing-intra-regional-trade-in-africa/
2Benin, Burkina Faso, Cabo Verde, Cote d’Ivoire, The Gambia, Ghana, Guinea, Guinea-Bissau, Liberia, Mali, Niger, Nigeria, Senegal, Sierra Leone, and Togo.
3See https://www.feedstrategy.com/africa/nigerian-state-attracts-fish-farming-investors/
Enzo Dominguez Prost is currently pursuing a master’s degree at Harvard Kennedy School (MPA/ID, expected graduation in May 2023). Previously, he worked in Argentina for five years in the Ministry of Production on topics related to industrial policy and international trade. He has a BA (2012-2015) and a MA (2016) in Economics from “Universidad de San Andrés” (Argentina).
Namibia’s Diversification Strategy: Finding A Way Forward
Namibia is a country of 2.5 million people that gained independence from South Africa in 1990 and shares a legacy of apartheid that informs the socio-spatial distribution of its citizens. Its economy is highly reliant on the exports of a few primary commodities, such as minerals like diamonds, copper, uranium, gold, and zinc, and agricultural goods like fish and livestock. The mineral economy drives much of the growth of the country. Similar to my country, Peru, Namibia had a period of high growth during the commodity boom (2002 – 2015) but is now facing a growth challenge because of exogenous shocks such as falling commodity prices and COVID-19.
The Growth Lab is supporting the Government of Namibia (GoN) in the quest of finding new growth drivers that promote inclusive development. The project covers a wide range of research activities, such as: understanding the drivers of macroeconomic sustainability, diagnosing the constraints to growth and identifying the most binding structural barriers preventing Namibia from realizing sustainable growth and diversification opportunities, studying inequality and labor market dynamics across the country, and analyzing the economic and export diversification opportunities by applying the framework of complexity analysis. A key objective is leveraging the existing capital-intensive industries (i.e., minerals) to set the basis for productive diversification towards industries that can employ more people with higher capabilities and jumpstart the Namibian economy.
Although productive diversification and inclusion are shared goals, there are different approaches being considered to foster these new opportunities. On the one hand, the GoN has consistently promoted “beneficiation” since 2012 through its homegrown agenda. The beneficiation, or value-added, strategy focuses on adding more value downstream to current exports. On the other hand, the Growth Lab sees productive transformation as focusing on sectors that are “similar” in terms of skills and capabilities because of the shared knowhow required in the production process. These opportunities are (i) implicitly revealed through production and export data – i.e., like the product space; and (ii) not necessarily along the lines of vertical value chains, which might seem unintuitive at first glance. Put simply, while many governments believe that a strategy to diversify should go from cotton to textiles, the Growth Lab finds evidence of an optimal strategy that may go from cotton to fruits or coffee. “Similarity” is better understood through knowhow in the production process rather than vertical value chain integration.
Nonetheless, the idea behind beneficiation is intuitive and appealing to an economic-political messaging about “doing more at home.”It is an appealing idea for many reasons: saving on transportation costs as well as secured and cheaper local supply, and domestic import substitution. It also supports a sense of national pride by promoting the notion that employment and skills “evolve” downstream to higher-value products. Moreover, in a country with a dependence on commodities, adding value is also seen as an option to reduce exposure to the volatility of the international markets (i.e., selling batteries is less volatile than selling copper).
However, the Growth Lab has empirical evidence proving that countries do not transform by adding more value to their existing exports down the value chain. Klinger et al (2008) assess the effectiveness of beneficiation by analyzing international trade data for 200 countries over the previous 50 years. The conclusions – which are aligned with the economic literature on the same topic – is that countries do not transform by adding more value to their existing exports down the value chain. Instead, countries accumulate productive capabilities, redeploy, and recombine them into larger sets of more sophisticated products and services. Hence, beneficiation is likely to be unsuccessful.
My role in the Namibia project during the internship largely consisted in creating a new dataset using Namibia’s trade data to identify and compare the two approaches to industrial diversification. Based on Klinger et al (2008), I worked on the analysis, refined it with members of the team and external experts, and then presented my work to the counterparts. My findings were used in the policy recommendations made by the Growth Lab team to the Government of Namibia.
These are just a few highlights of what I learned:
- Analysis is a stronger piece of evidence than intuitive arguments: During my internship, I helped advance the agenda by identifying the top 50 industries that should be prioritized following a beneficiation strategy, and preparing a graph that contrasted them vis-à-vis the industries identified in the economic complexity report within the same product space. The graph showed how beneficiation is “as good as random”: the prioritized industries require different sets of capabilities and can differ greatly from Namibia’s existing industries. The visual contrast between both strategies made a stronger point than any theoretical discussion.
- History matters, context matters, and public perception matters: In the MPA/ID program, we learn that policies are not just about what is technically correct. One must take into account political and administrative feasibility. Given the historically salient role of beneficiation in the country, and in the broader South African Development Community, it was politically complex to expect a full shift out from beneficiation, so the team proposed a “middle ground” strategy: following capabilities first, then beneficiating if that’s in the optimal set. Some products in the plastics and rubbers product group fit these criteria since they were both directly downstream and in line with the existing set of capabilities.
- It matters not only when assessing policy recommendations, but also when thinking about the messages we want to convey: In Namibia, the Growth Lab recognized that we were outsiders to the country and that our message could be perceived as though we believed that the country was not capable of adding value to its existing industries. Thus, we looked for examples of industries where Namibia currently adds value to imported products (i.e., copper) to make the point that we do believe they are able to add value, but that it did not necessarily have to be to domestic products.
- Every good idea on paper leads to a lot of effort to implement them in order for them to materialize: Many policy recommendations sound reasonable on paper but fail to delve into how policymakers can actually “make it happen” given the existing organizational capacity and institutional setup. To address this natural gap in going from ideas to action, the Growth Lab facilitated the introduction of productivity taskforces and developed a framework of best practices to show how policymaking could be implemented to reduce coordination failures that constrain diversification efforts. As part of this process, we met with counterparts in the GoN to first understand similar efforts in the past to set up such taskforces and we incorporated those learnings into our recommendations.
- You cannot pursue single policies in isolation of other policy priorities. They have to complement each other. Fiscal sustainability and industrial policy had to go hand-in-hand: While diversification is a way of addressing Namibia’s growth and inclusion challenges, the team was also very aware of the fiscal constraints that the GoN currently faces. To that end, we argued that a beneficiation strategy was likely to require more fiscal resources given the big push needed to develop new capabilities. Similarly, a key best practice for the implementation of productivity taskforces is that they should not focus on measures that increase profits for firms (i.e., tax benefits), but on measures that help increase overall productivity.
Development in Practice: Practical Applications of Economic Complexity in Ethiopia
By: Aziz Ben Baz (MPA/ID ’22)
Over the summer, I had the chance to work with the Growth Lab (GL) at Harvard’s Center for International Development (CID) on the Advancing Economic Diversification in Ethiopia project. One of the main reasons I chose to pursue the MPA/ID program at HKS is that I was a counterpart for the GL in my previous work. As such, it was a primary focus of mine to get immersed in the GL work during my time at HKS to get a higher exposure to the pioneering work done on International Development.
The Growth Lab started collaborating with multiple stakeholders in the Ethiopian Government in 2019. The culmination of GL’s initial findings on economic complexity in Ethiopia were put eloquently in the “Pathways for Productive Diversification in Ethiopia” paper which cites that one of the main binding constraints for economic development in Ethiopia is the access to foreign exchange. The two main frameworks used for such work were Growth Diagnostics and Economic Complexity. In this report, not only do policymakers get an informed analysis on which areas of economic policies to focus on, but they get a prioritized list of products that Ethiopia could target in order to unlock the next phase of economic growth. For Ethiopia, it is crucial to increase and diversify the export basket in order to afford imports required for further development, which would address the shortage of foreign exchange highlighted earlier.
My primary focus over the summer was to help the Ethiopian Investment Commission (EIC) take the Economic Complexity framework findings a step further and find practical applications. While the framework is useful as a first step to shortlist possible products a country could target, policymakers still need to do more due diligence on products viability and how to put such insights into action. For example, we conducted two deep dives for two different products, one related to Agriculture and the other to Machinery. The intention was to see how such products would require a different set of skills and possibly different policy levers to unlock and push forward. It is relatively easier (i.e., shorter distance in the Product Space) for Ethiopia to start targeting agro-processing due to its reliance on the Agriculture sector. Indeed, some of the industrial parks in Ethiopia are focused on fostering food and beverage processing by attracting more investors into the sector. But the trade-off is that such products are not particularly high in terms of economic complexity and would still face challenges to sustain economic growth. It is important to note that the intention is not to minimize the role of the Agriculture sector and the further development of the Value Chain. But rather how to “balance” the portfolio of targeted products by also selecting more complex ones (i.e., Machinery) and develop a strategy around that.
To that end, we tailored a specific approach to study the viability of the more complex products in the Economic Complexity framework, specifically by looking into Machinery. This was done by looking into the Economic Complexity metrics (see Growth Lab’s Atlas of Economic Complexity) and the dynamics of supply and demand (with emphasis on exports/imports) domestically, regionally, and globally. We also looked at the size and trends of investment flows to such sectors, major players, as well as the comparative advantage of Ethiopia and the tariffs dynamics versus its regional peers. We then identified specific tangible sub-products that are potentially viable and have a relatively reasonable existing footprint in terms of imports and exports, which could help in addressing the shortage of foreign exchange in Ethiopia.
We also leveraged a few more concepts into this work to compliment the Economic Complexity framework. For example, we’ve integrated concepts from the “Productive Ecosystems and the arrow of development” article by O’Clery, Yildrim, and Hausmann (2021). We also looked into the environmental aspects of the prioritized products by adding insights from the Green Transition Navigator. Lastly, we employed a Gravity Model that was developed by the GL to determine possible destinations for Ethiopia’s exports.
As for the next steps on this effort, there are still key areas that remain to be explored, especially ones related to understanding who are the current Ethiopian exporters and importers of the targeted sub-products and the challenges they face. Such essential missing information would inform the available policy options and test the viability of the selected sub-products in Ethiopia. It is important to acknowledge that applied economic research has to cater to realities on the ground. As such, the input from our counterparts in Ethiopia is very crucial. Many of the limitations and nuances can only be uncovered by those who live and breathe these problems every day.
It was refreshing to work with GL on such challenging development topics after an intense academic year at the MPA/ID program. The work done at the GL provides a sweet spot between academic rigor and applied policy research. It was a truly great learning experience. I’m very grateful for the mentorship of all the researchers, professor Ricardo Hausmann, my fellow classmates interning at the GL, and all of the GL staff who helped along the way.