Search Growth Lab
Search
Policy Area
Research Project
Content type
Country/Region
Research Type
Author
-

Project
Digital
Aid Explorer
The Aid Explorer was developed as a tool to facilitate better aid coordination. You can relate any aid organization or development issue with a country and determine whether the agencies with an interest in that particular country also have an interest in the issue. -

Project
Colombia
Colombia Atlas of Economic Complexity
The Atlas of Economic Complexity of Colombia (Datlas) is a diagnostic tool for the productivity of departments, cities, and municipalities. -

Project
United States
Mapping the Functional Structures of State Governments
Researchers find economic structure trumps income, location and ideology when examining differences in U.S. state governments. -
Project
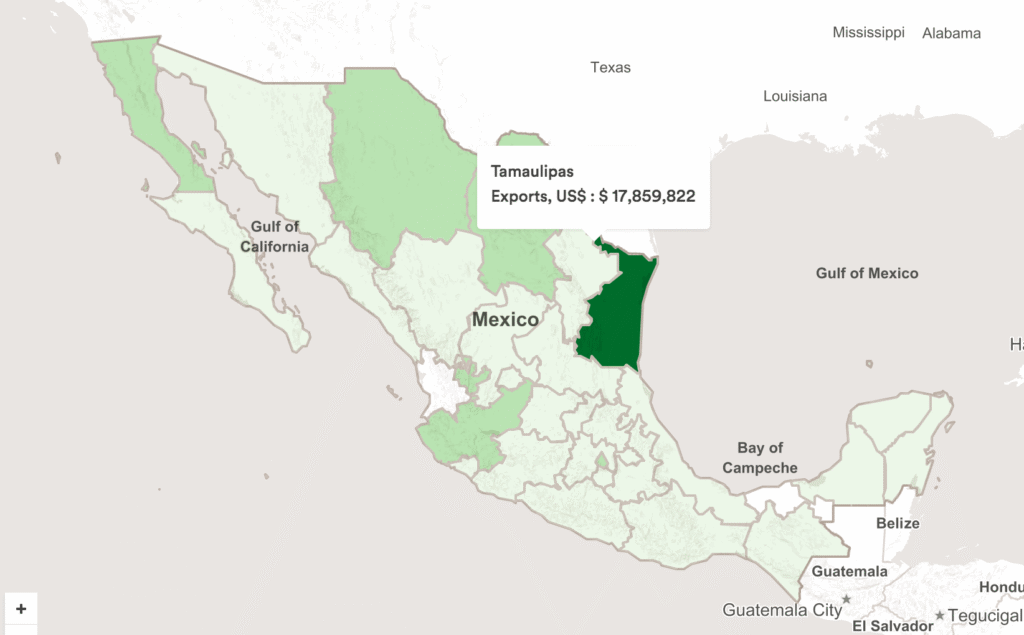
Mexico
Mexico Atlas of Economic Complexity
Large income gaps prevail across regions in Mexico. Nuevo Leon exhibits levels of productivity similar to those of South Korea, while Guerrero and Chiapas experience productivity levels below Honduras. These large disparities reproduce even as we break into smaller geographical units: Tuxtla Gutierrez, Chiapas’ capital, has eight times the income of Aldama and Mitontic, its poorest municipalities. -

Project
Latin America
Peruvian Atlas of Economic Complexity
The Growth Lab developed The Peruvian Atlas of Economic Complexity as a diagnostic tool that firms, investors and policymakers can use to visualize economic patterns and geographical distribution of exports, assess the export ecosystems of departments and provinces, and identify potential opportunities for diversification of products in each location. -
Publication
Albania’s Industry Targeting Dashboard
The Growth Lab’s VizHub
This industry targeting tool is custom-made for Albania. Users can choose any of 272 industries (based on NACE Rev. 2 industry codes) from the above drop-down list and explore the […] This industry targeting tool is custom-made for Albania. Users can choose any of 272 industries (based on NACE Rev. 2 industry codes) from the above drop-down list and explore the industry’s match with Albania’s current productive capabilities and comparative advantages and disadvantages. The tool is designed for use by government and non-government entities that seek to attract foreign direct investment (FDI) to Albania to accelerate economic development. Harvard Growth Lab research in Albania shows that the long-term pace of economic growth will be determined by the pace at which the country can absorb new economic activities and productive capabilities from abroad. Detailed information on the methodology and data sources used in this tool can be found here. This tool can be used in combination with the Growth Lab’s Atlas of Economic Complexity to explore patterns in global trade in very high detail.
 -
Publication
Colombian Diaspora Survey Results Dashboard
As part of the “Role of the Diaspora in the Internationalization of the Colombian Economy” project, Growth Lab researchers surveyed 11,500 members of the Colombian diaspora, located in well over […]As part of the “Role of the Diaspora in the Internationalization of the Colombian Economy” project, Growth Lab researchers surveyed 11,500 members of the Colombian diaspora, located in well over 100 countries. They studied the migration journeys, the diaspora’s attachment to Colombia, the level of diaspora engagement and interest in engaging, the intentions to return back home, the interest in diaspora government policy, and the overall sentiment of the diaspora towards Colombia. -
Working Papers
Growth Diagnostics and Competitiveness Study of the Manufacturing Sector in Tanzania
Tanzania’s manufacturing puzzles (and frustrations) seem to be a natural outcome of their policy choice. The Tanzanian economy experienced a significant acceleration over two decades, growing at a compounded annual […]Tanzania’s manufacturing puzzles (and frustrations) seem to be a natural outcome of their policy choice. The Tanzanian economy experienced a significant acceleration over two decades, growing at a compounded annual growth rate of 6% between 1998 and 2018: Largest rates were recorded and sustained by the super commodity cycle (2005-2014). Within that growth trajectory, manufacturing’s share of gross domestic product (GDP) has lingered for 30 years below 10% – well below the 23% target established for 2025 in Tanzania’s Industrial Development Strategy (2011). As stressed by Diao et al (2021), the bulk of manufacturing value added is created by a few capital-intensive firms, whereas informal manufacturing has increased employment but without significant improvements in productivity/wages. Manufacturing exports surged in 2011 and remained steady since driven by subsector basic metals (gold & unrefined copper). If these are excluded, the curve mirrors the commodity price boom (likely a price boom rather than a volume boom). Looking only at exports conceals the fact that the bulk of the manufacturing output in Tanzania is sold in the domestic market rather than exported: exports are equivalent to less than 2% of GDP; domestic sales are seven times higher. While Food and Beverages make up for the largest share of manufacturing value employment and value-added, basic metals are the ones accounting for the vast majority of Tanzania’s exports.
The most binding constraint to investments in manufacturing in Tanzania is the availability and quality of electricity supply: Access to electricity is the lowest among peers, with large disparities between rural (22%) and urban (70%). Electrical outages are frequent and expensive for the manufacturing sector; firms even plan their production schedules and decide on plant locations based on power reliability. And yet, when we analyze the share of value-added against energy intensity at the sub-sector level, the negative relationship to be expected if electricity is indeed the constraint is there, but too fragile and noisy. Why? The strongest evidence points to the role of trade protection in compensating firms for other constraints, allowing existing manufacturers to capture large shares of domestic value-added while remaining uncompetitive in export markets. Large manufacturing subsectors of moderate to high energy intensity and more capital intensive enjoy higher tariff protection, creating a wedge that allows these industries to thrive in the domestic market. Despite joining numerous free trade agreements, Tanzania remains one of the most restrictive countries from a trade standpoint, eased by filing exceptions that shield individual products and entire domestic industries from competition. We have also found that effective taxation in Tanzania is relatively higher on labor (lower on capital, materialized through massive tax holidays granted within SEZ), skewing returns away from the country’s relative labor abundance. Failure to address the binding constraints creates a rationale for upholding protection, which reinforces biases towards capital and energy-intensive sectors. These policies go a long way in explaining the Tanzanian manufacturing puzzle.
-
Journal Articles
Tackling Discrepancies in Trade Data: The Harvard Growth Lab International Trade Datasets
Bilateral trade data informs foreign and domestic policy decisions, serves as a growth indicator, determines tariffs, and is the basis for financial and investment decisions for corporations. Accurate trade data […]Bilateral trade data informs foreign and domestic policy decisions, serves as a growth indicator, determines tariffs, and is the basis for financial and investment decisions for corporations. Accurate trade data translates into better decision-making. However, the raw bilateral trade data reported by UN Comtrade suffer from two structural problems: reporting differences between country partners and countries reporting in different product classification systems, which require product-level harmonization to compare data across countries. In this paper, we address these challenges by combining a mirroring technique and a data-driven concordance method. Mirroring reconciles importer and exporter differences by imputing country reliability scores and applying a weighted country-pair average to calculate the estimated trade value. We harmonize product classifications across vintages by calculating conversion weights that reflect a product’s market share. The resulting publicly available datasets mitigate issues in raw trade statistics, reducing reporting inconsistencies while maintaining product-level granularity across six decades.