Tools
The Growth Lab translates research and insights into online web applications and interactive storytelling, all made publicly available and utilized by a global community of policymakers, scholars, investors, and journalists.
Our tools are produced by the Growth Lab’s Digital Development & Design Team, an interdisciplinary group that connects economic and policy research with best practices from information design, software development, data science, product management, and digital humanities. These tools allow us to engage with a wider audience and ensure our research efforts can make a difference in people’s lives, company productivity, and government policy efforts.
Jump To
Viz Hub
The Viz Hub is a portfolio of visualization tools, interactive stories, and supporting software packages, powered by the Growth Lab’s research.
Atlas Projects
Atlas of Economic Complexity
Build custom data visualizations for any country to reveal 50+ years of global trade flows across 6000+ goods and services, along with new opportunities to drive growth.
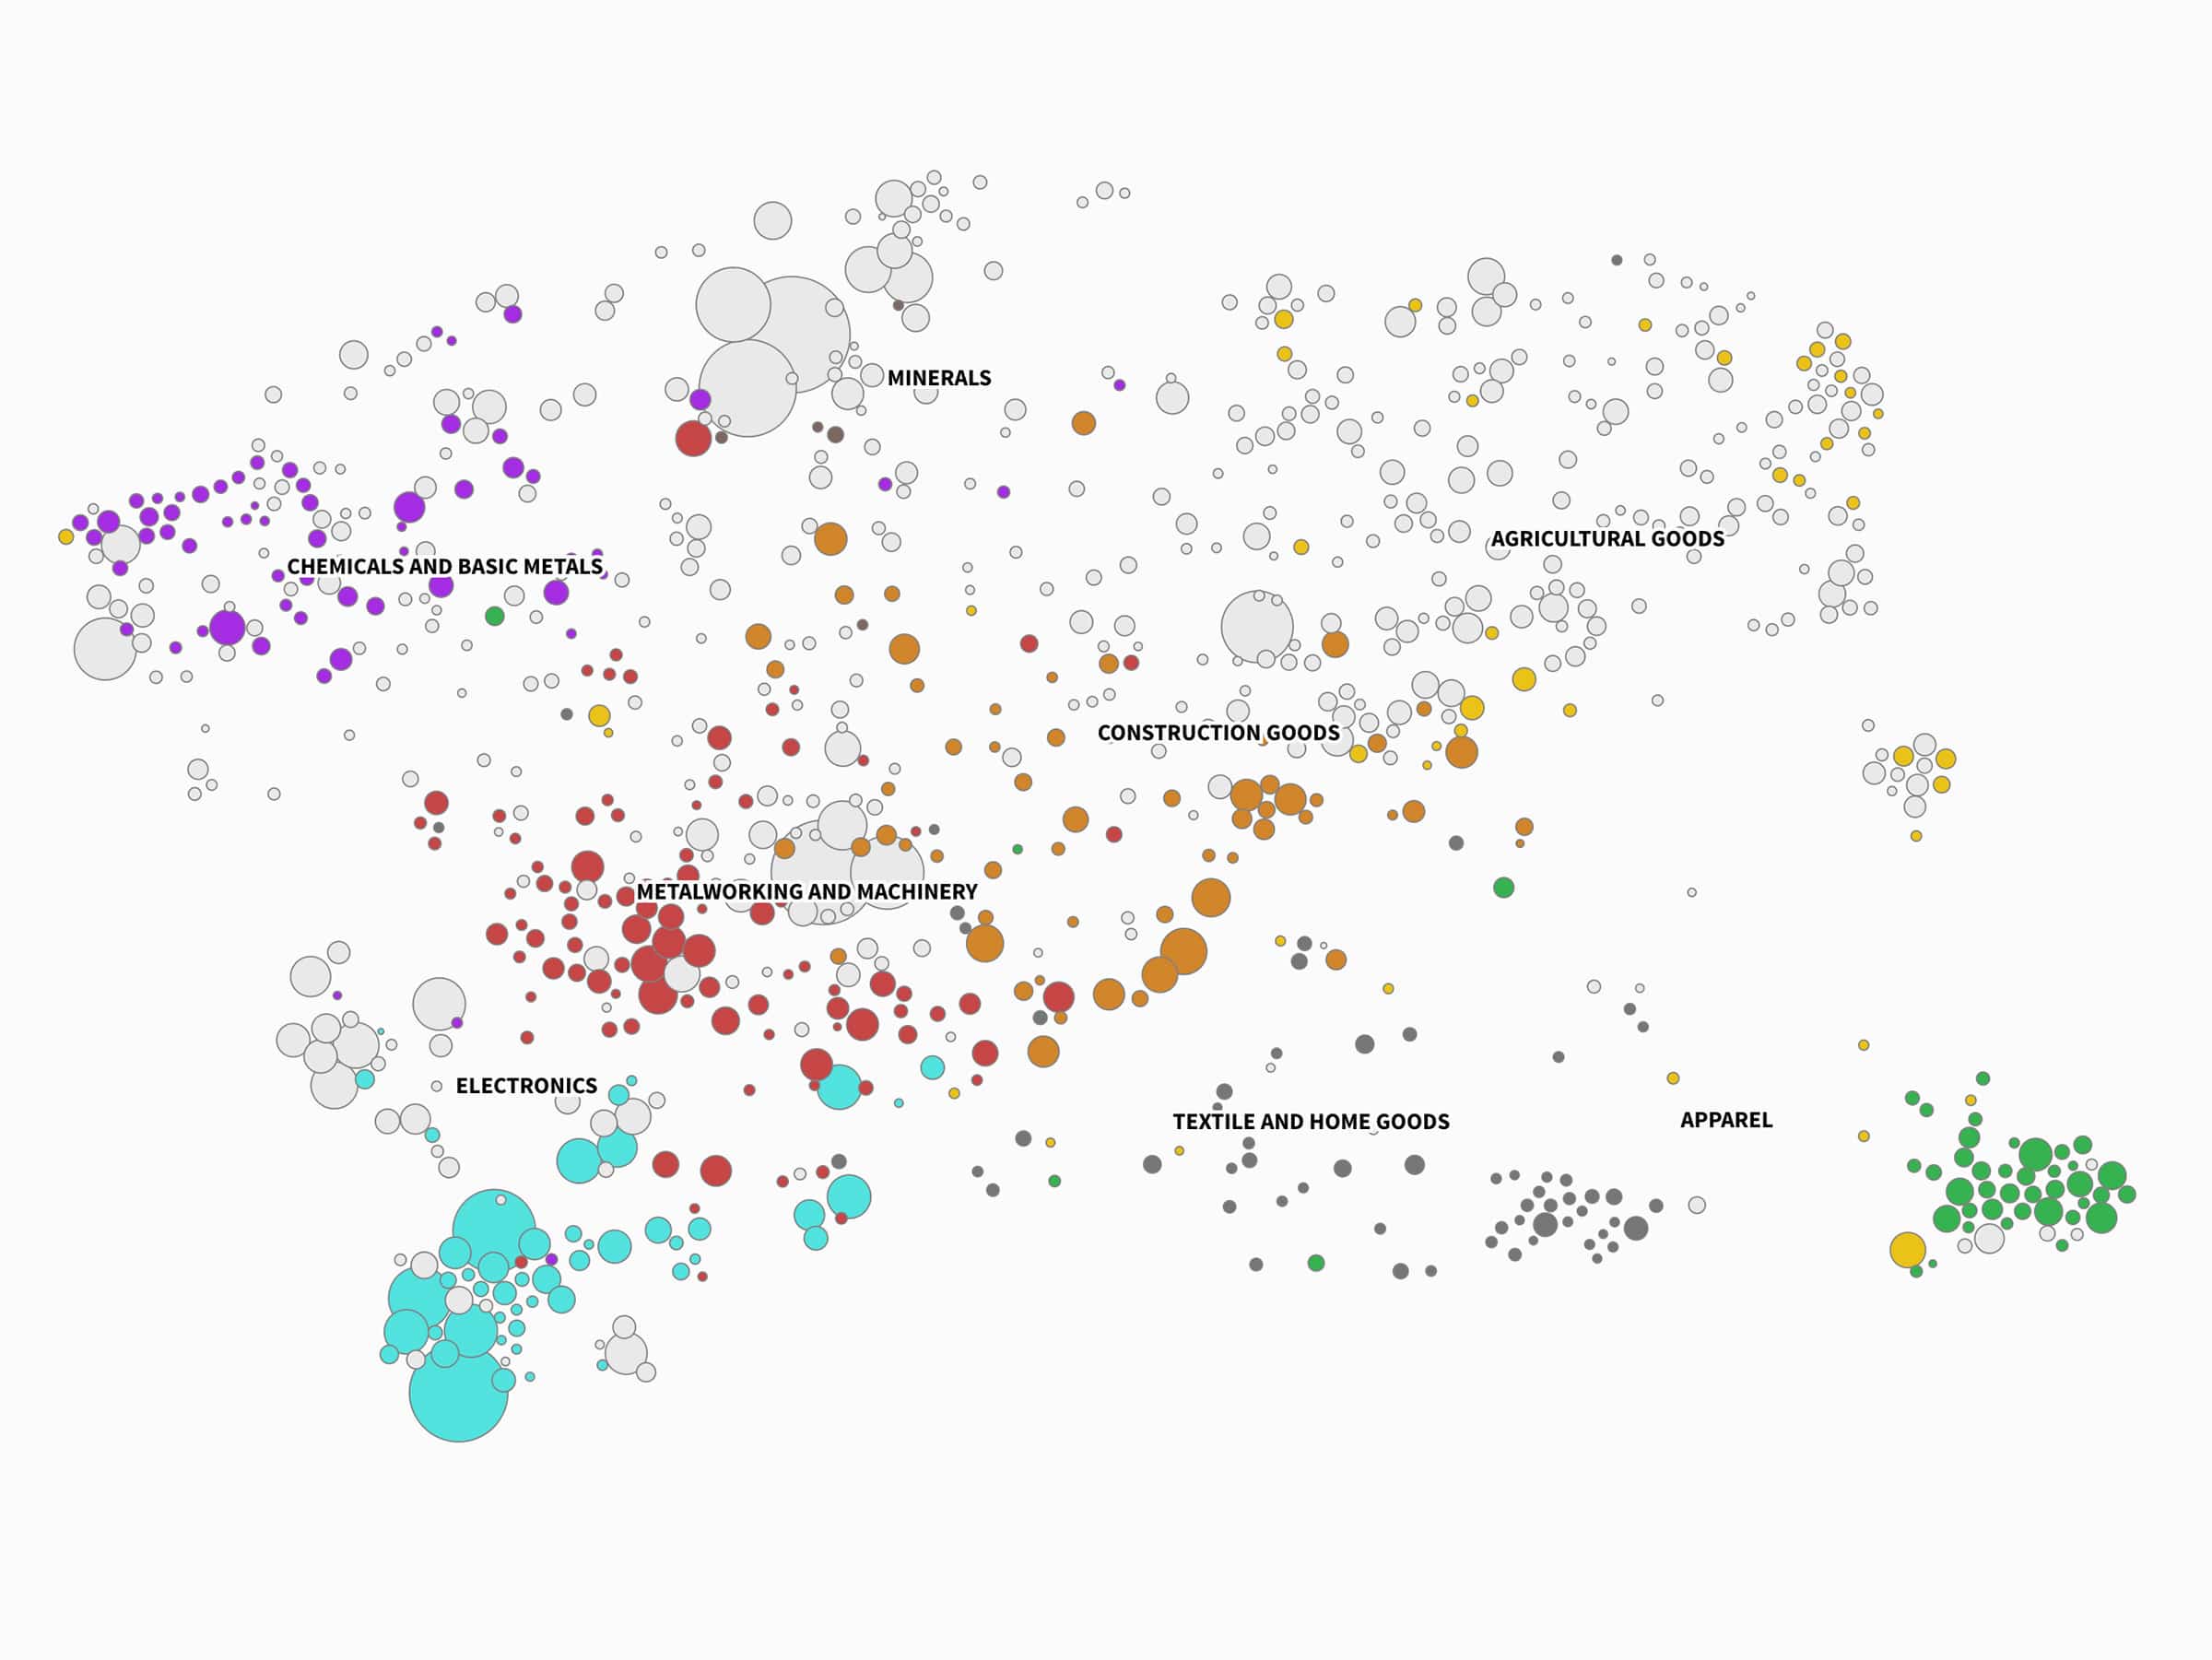
Metroverse
Urban economy navigator illustrates the technological capabilities for more than 1,000 cities worldwide and the opportunities for future growth and diversification.
Country Dashboards
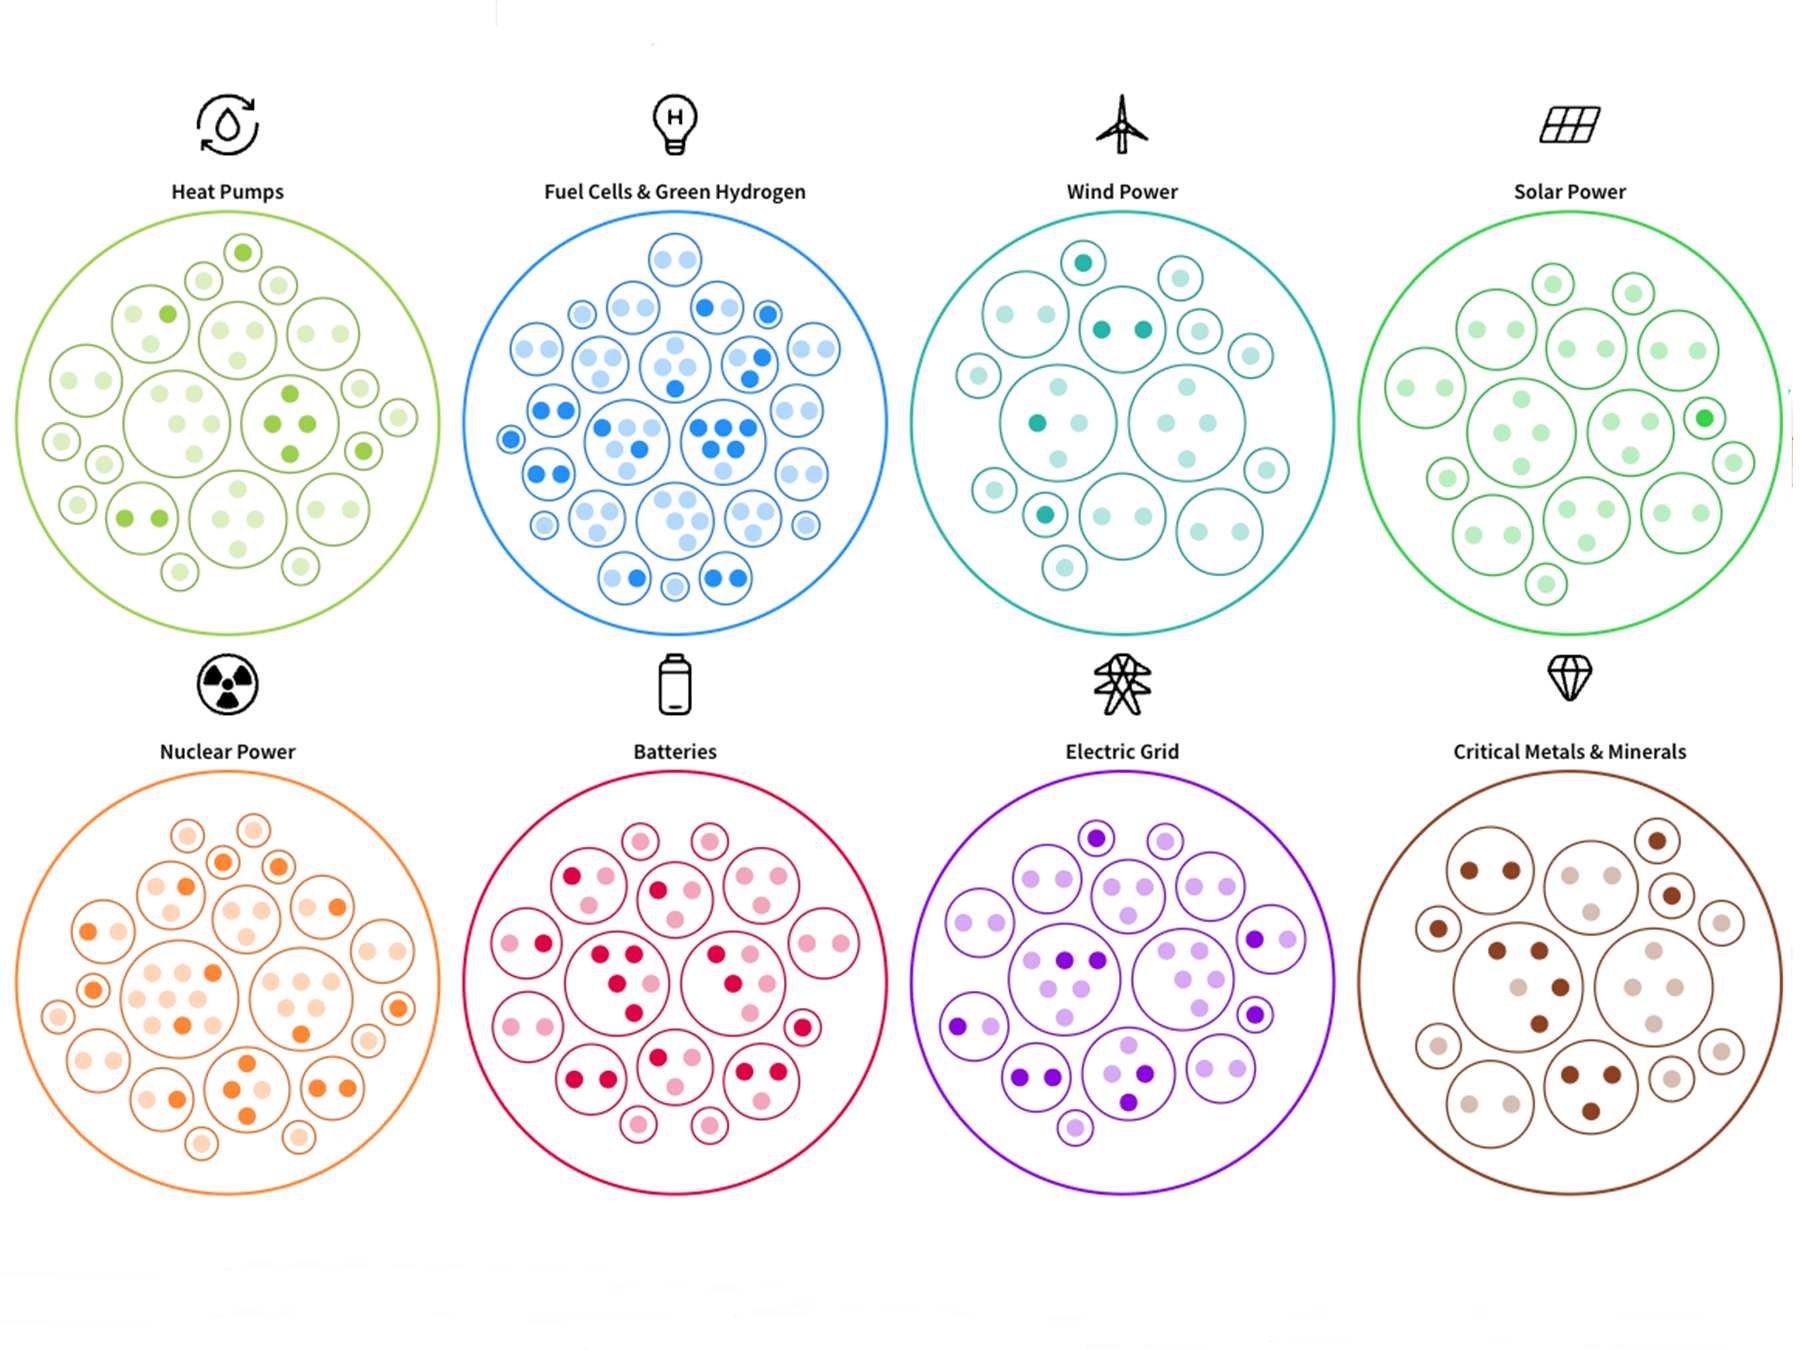
Greenplexity
Visualize a country’s opportunities to develop a manufacturing base in green value chains. Includes 10+ years of data for green value chains, and strategic outlooks for more than 140 countries.

Jordan’s Complexity Profile
Displays the results of the complexity analysis developed to provide a roadmap to identify the economic activities with the highest potential to diversify Jordan’s export basket and drive growth, while supporting higher wages.
Visual Stories
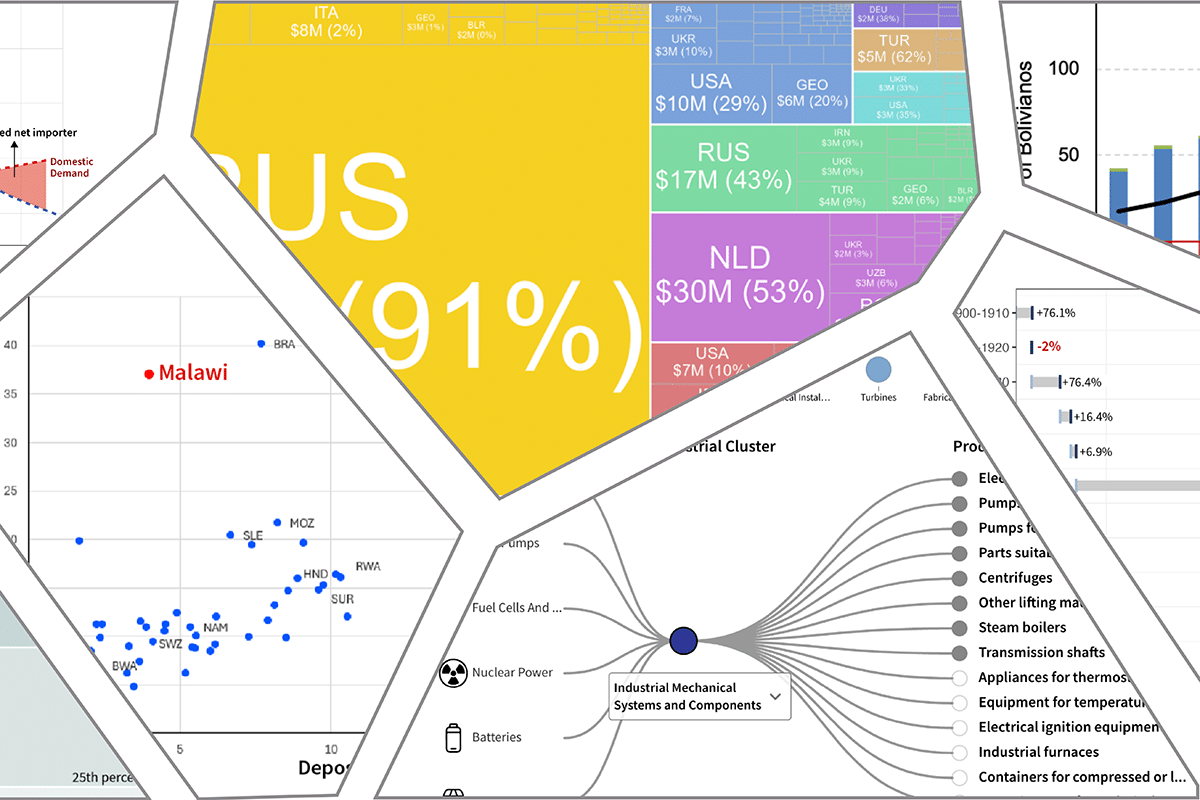
Top Visual Insights of 2025
Our research in 2025 spanned nine countries across five continents and investigated economic crises in Bolivia and Malawi, clean energy industrial transition strategies, oil diversification and new engines for growth, depopulation and workforce challenges, and much more. Below, we showcase some of the most insightful visualizations from our research portfolio.
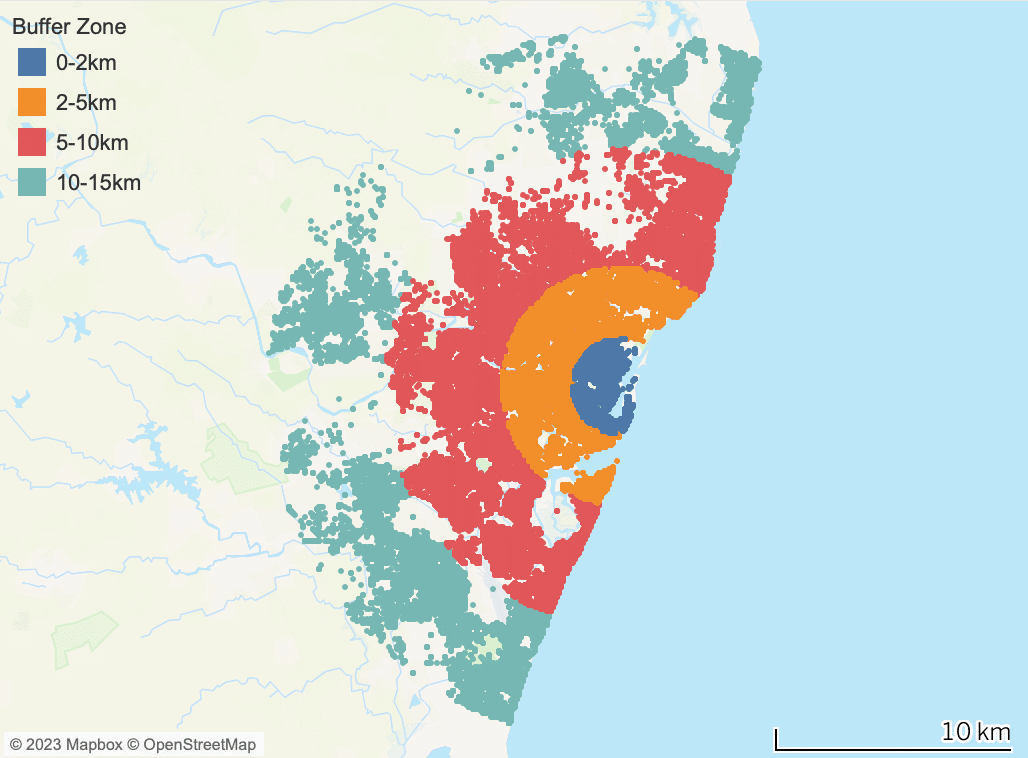
Harboring Opportunity: The Industrial Ecosystems of Port Cities
While we often think about ports as gateways for transporting goods and materials across cities, countries, and continents, it is also relevant to ask: how do ports play a role in shaping their local economies? In this visual story, we explore how port cities can capitalize on their productive strengths to develop other industries.
Impact
215+
Countries with active users
2.2M
New users since 2013
10.1M
Page views in 2024
30
Tools & Software shared online
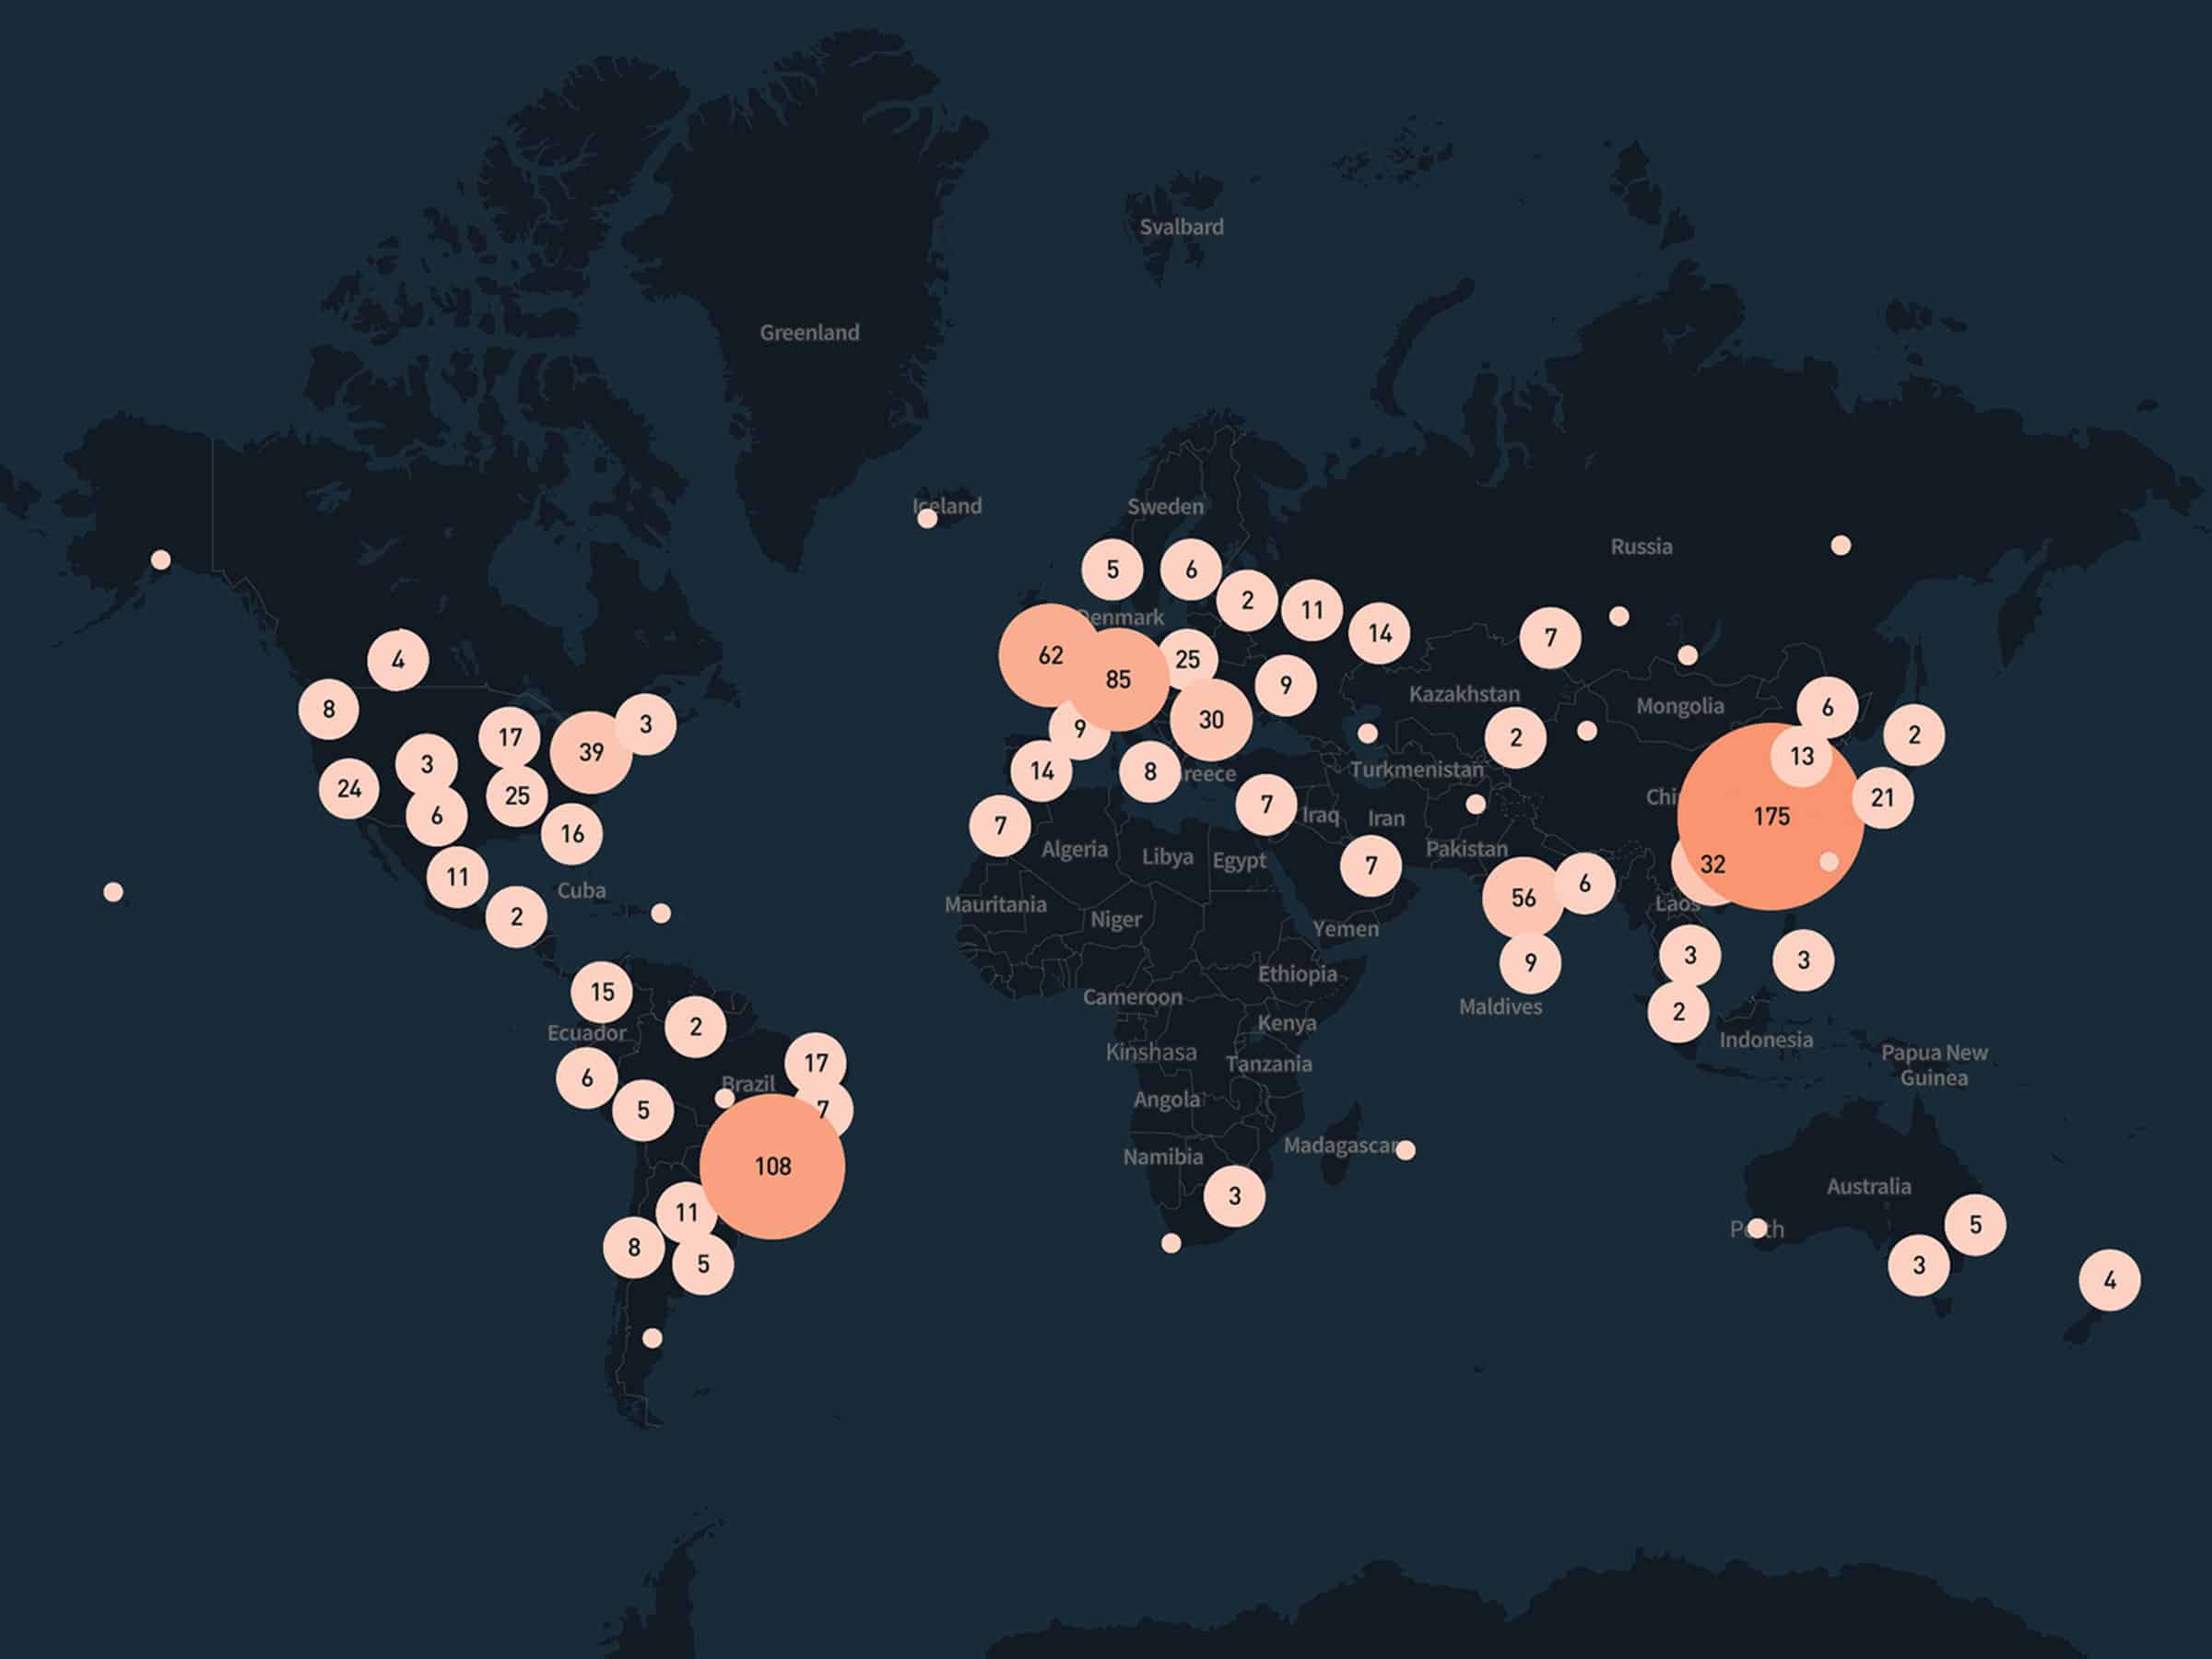
Our Tools in the World


Our Awards and Press
Our digital tools have been featured in various media outlets, including the New York Times, Wall Street Journal, Washington Post, Bloomberg, Financial Times, and the Harvard Gazette. In 2022, Metroverse won the Silver Award in the Business Analytics category of the Information is Beautiful Awards. In 2019, we were the 2nd runner-up for the Digital Humanities Best Data Visualization Award.


Data-driven decision-making results in better policy determinations. Metroverse enables users to not only pull important economic development data for their region but see it in the context of other influencing factors, thus deepening one’s understanding of how to ensure and sustain economic growth.”
Barbara Leslie, President & CEO of Oakland Metro Chamber of Commerce

Our Team
Get to know the Growth Lab’s Digital Development and Design team.

Support Our Mission
Our digital tools are made possible through the support of organizations that align with our mission to advance inclusive growth and prosperity. To learn more about how you can support the Growth Lab, email Andrea Carranza or call (617) 384-5734.